
How to make an org chart
Make an org chart people can trust: what to collect, how to show reporting and dotted lines, and how to draw and share one for free in FlowDraw.
An org chart looks simple until you draw your own. Someone has two managers, a role is vacant, and your list is already out of date. To make an org chart people trust, settle a few things before you place the first card.
Quick AnswerAn org chart shows who reports to whom. To make one, collect each person’s name, role and manager, start with the top of the group you are mapping, add one level at a time, and keep people of the same rank on the same row. Date it and name an owner.
What is an org chart?
An organizational chart is a tree of people or roles, with lines for reporting.
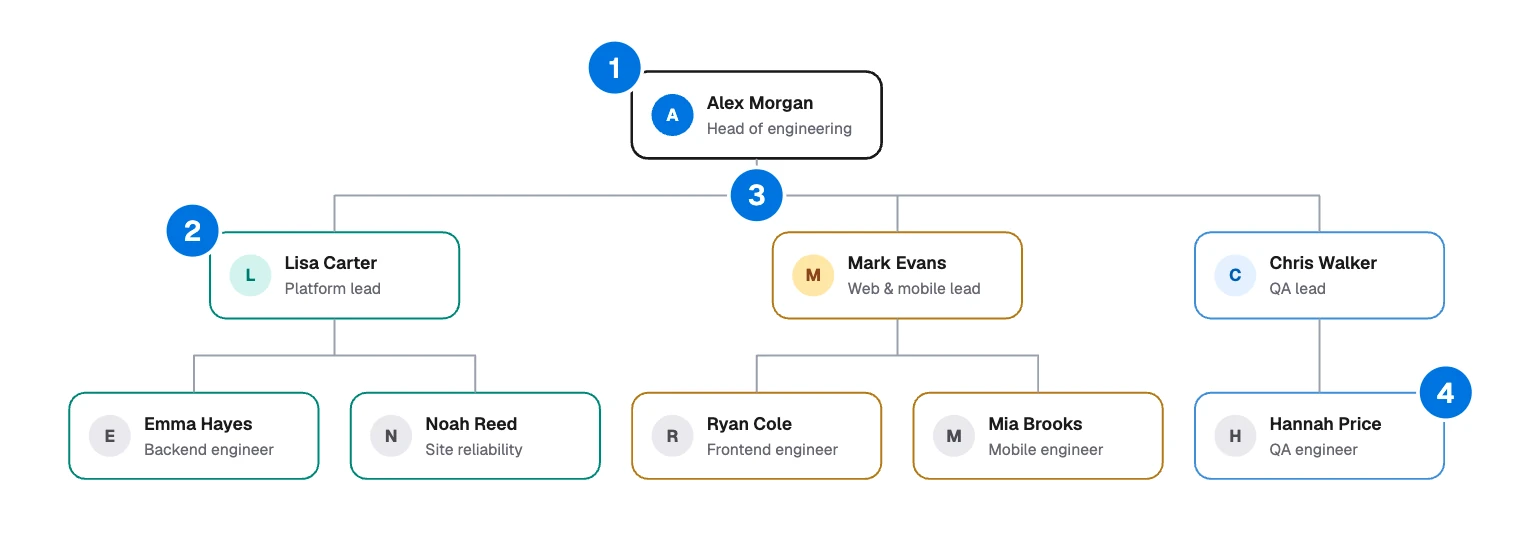
- Top card: the head of the group you are mapping.
- Row: people of the same rank.
- Line: who reports to whom.
- Color: which team a card belongs to.
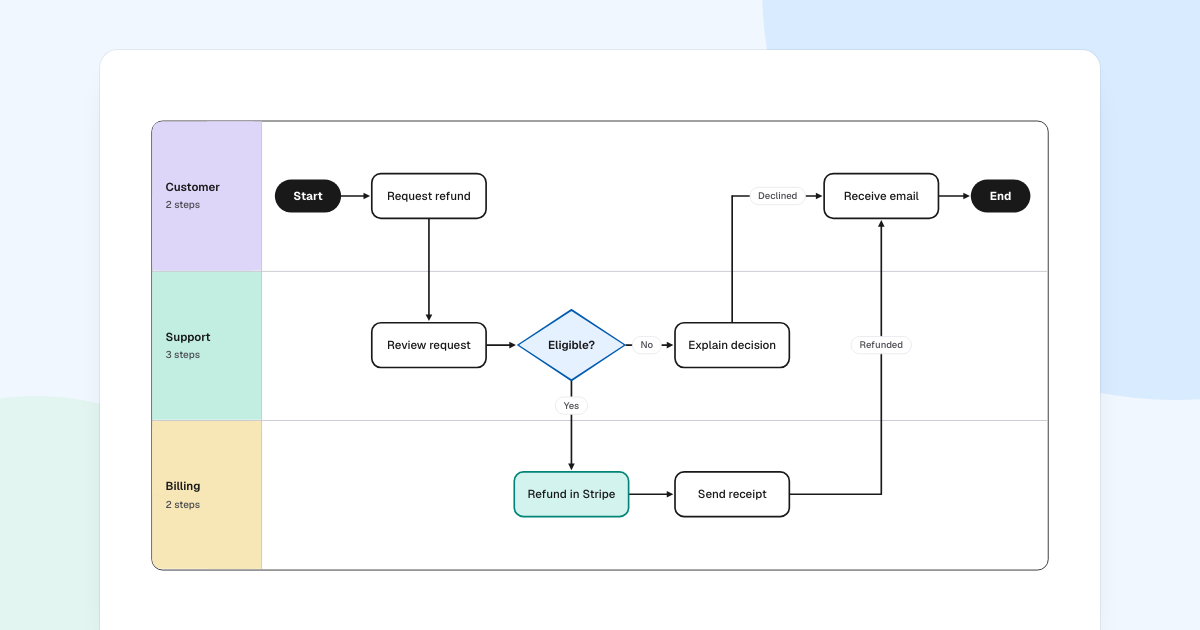
It answers “who is this person’s manager?” and “who works in this group?“. It does not show how work moves. For that, a swimlane diagram fits better.
Decide who it is for
The same company can need three different charts. Settle this first, because it decides what goes on each card.
| Reader | What they need | How far down |
|---|---|---|
| New hires | Name, role and team | Their own department, in full |
| Leaders planning a change | Roles, open positions, current and proposed lines | Only the groups affected |
| Customers or investors | Leadership names and roles | The top one or two levels |
Types of org chart
- Hierarchical. Each person has one manager, and teams sit under a shared head. This is the common case, and the example here is one.
- Divisional. The first level splits by product, region or customer, and each division has its own functions beneath it.
- Matrix. People have two lines, usually one to a function and one to a project. Draw the main line solid and the other dashed.
- Flat. Few levels and many people per manager. If the chart is one long row, a team list may serve readers better.
How to make an org chart
Collect a list, not memories
Ask whoever runs people data for one row per person: name, role, manager. Working from memory is how charts get names and titles wrong.
Fix the scope and the top
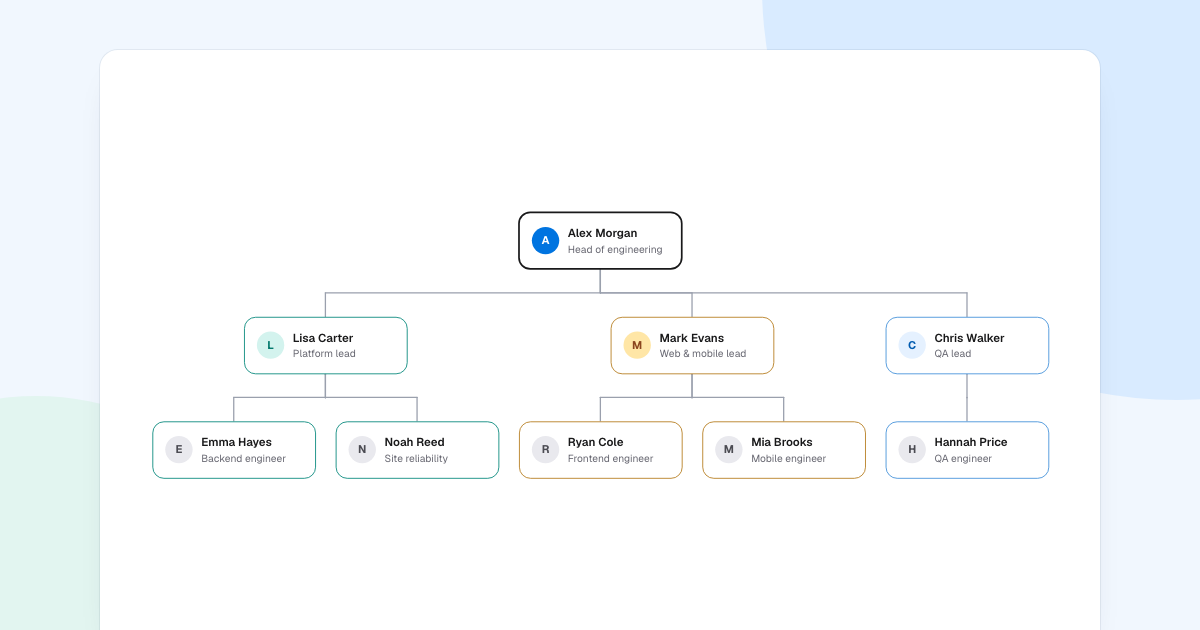
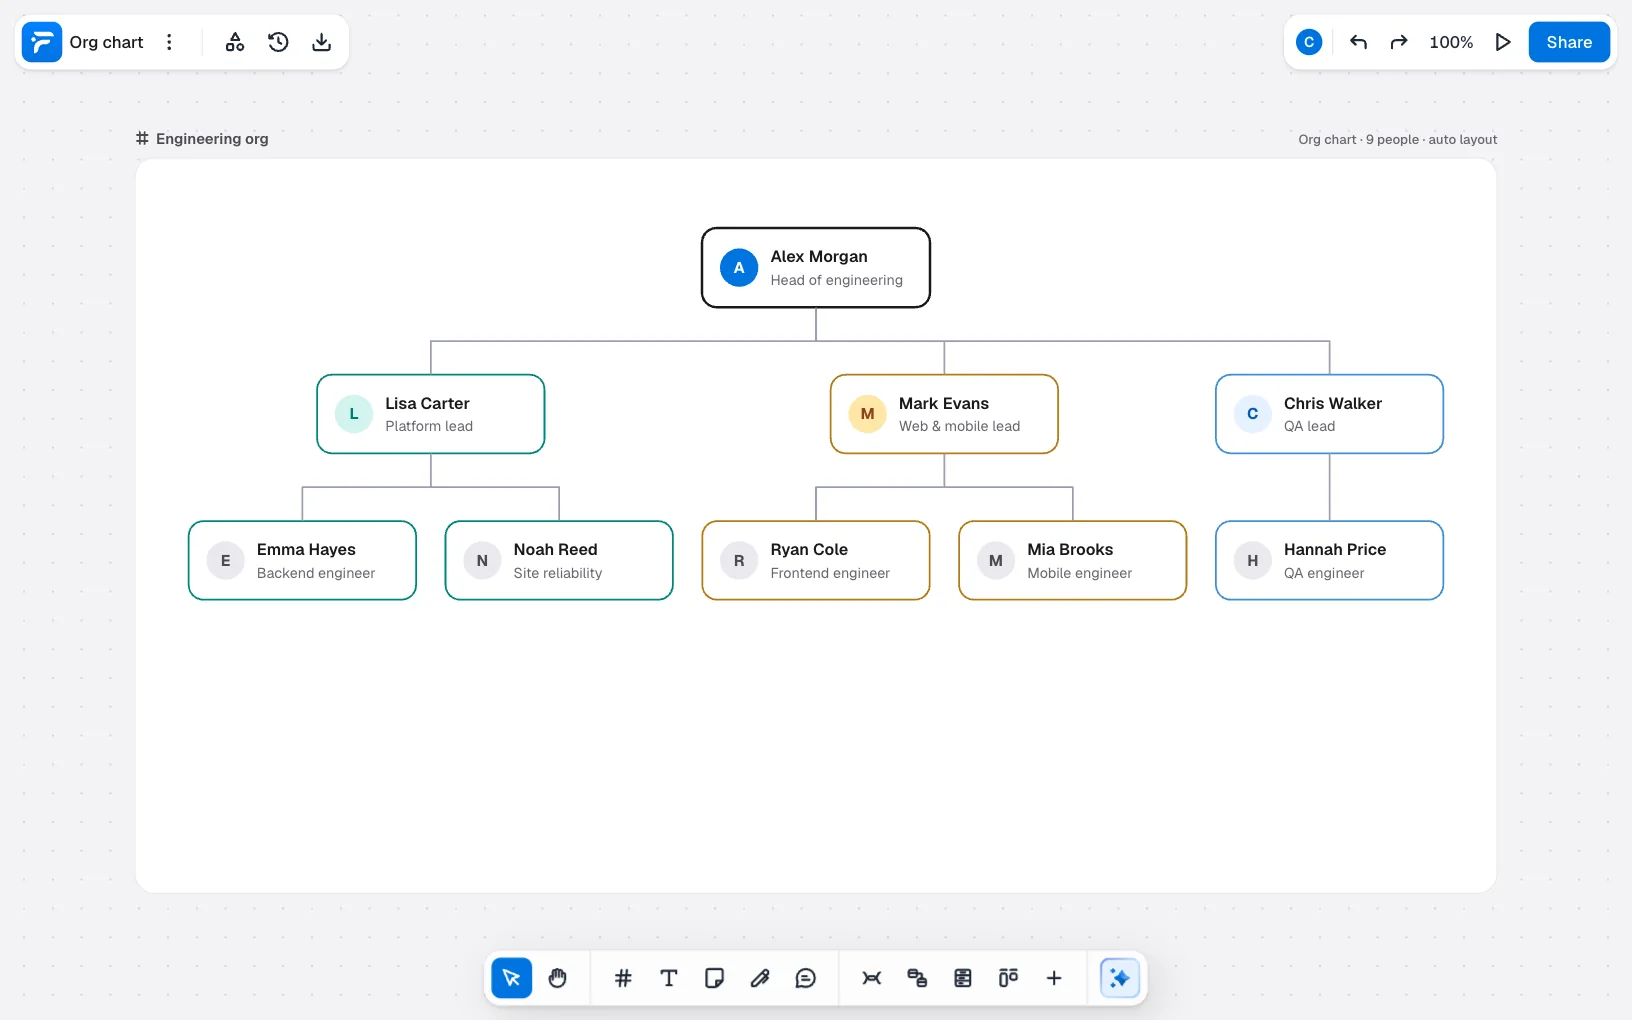
“Engineering, as of today” is a scope. This chart starts with Alex Morgan, Head of engineering, and stops at the people who report to the three leads.
Draw one level at a time
Place the top card, then the direct reports on one row, then theirs. Keeping the same rank on the same row keeps the shape of the team honest.
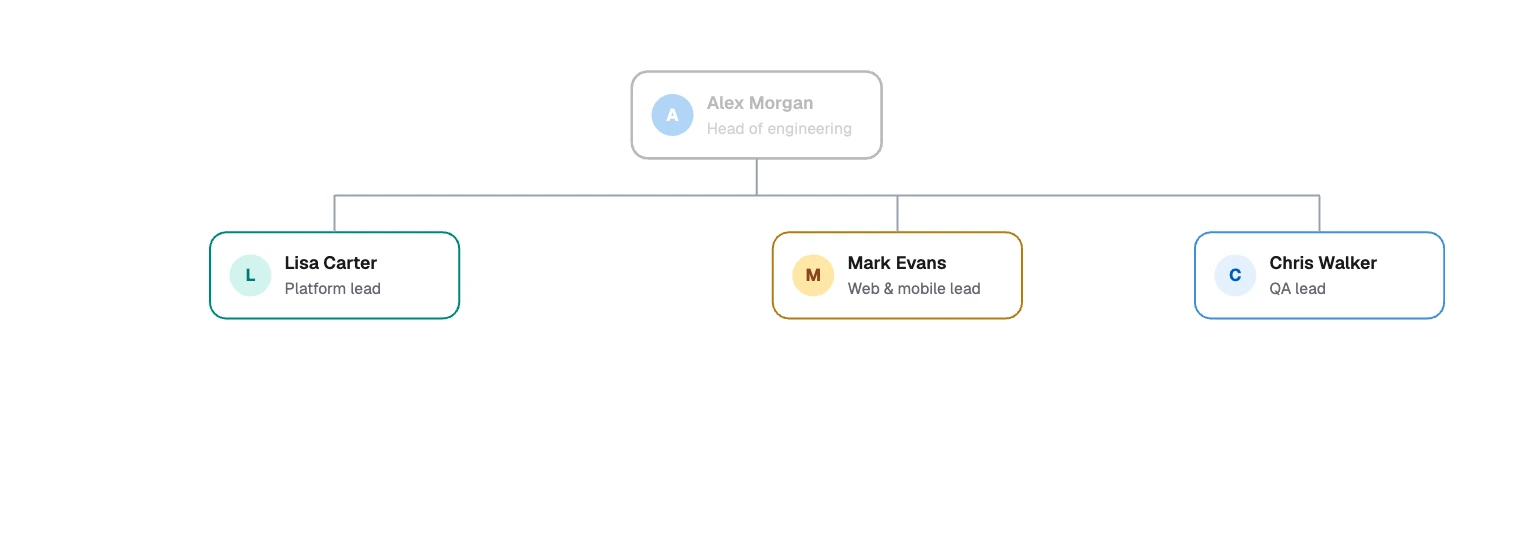
Direct reports first, all on one row Group by team
Keep each manager’s reports together, and use color only for grouping. Lisa and Mark have two reports each and Chris has one. That unevenness is worth seeing.
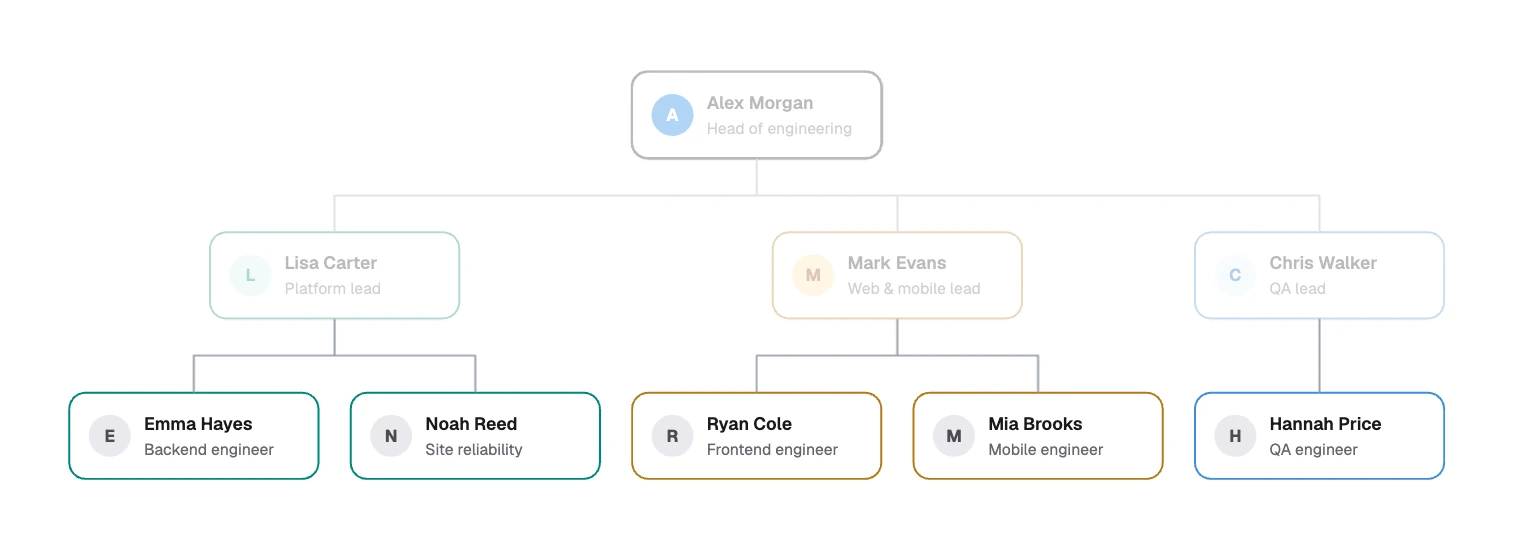
Each manager's reports stay together Handle the awkward cases
Draw a second manager with a dashed line. Show an open role as a card that says so. Mark contractors in the role line if your readers need to know.
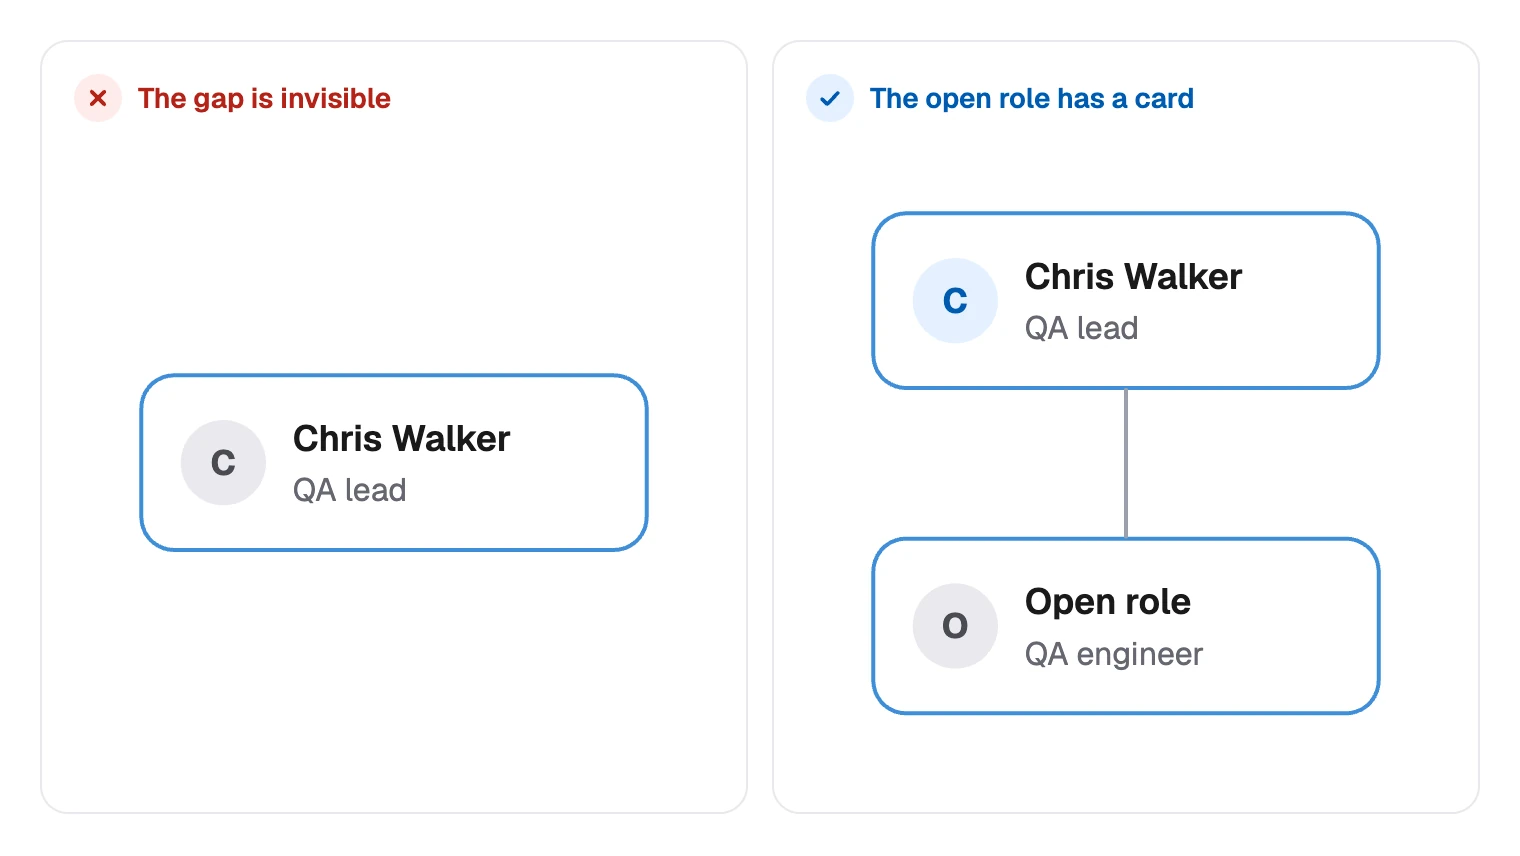
Show the vacancy instead of hiding it Date it and name an owner
Put “Checked 5 Nov” and an owner’s name on the board. Readers need both to decide how far to trust it.
Make an org chart in FlowDraw
Org charts are free on every plan: the template, the “Org chart” tool and the Org chart shape library.
Start the chart
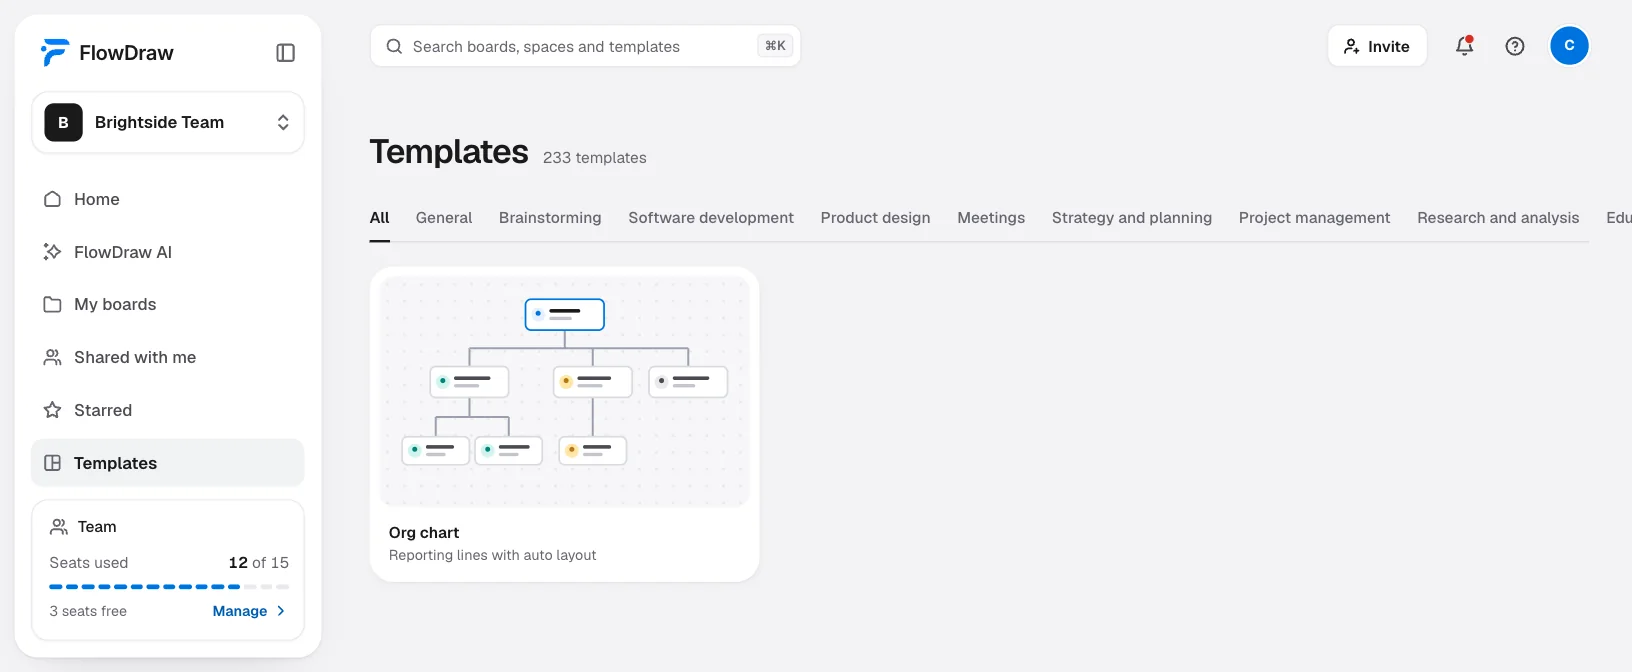
On Home, click the “Org chart” tile, or search for it under “Templates” and click “Use template”. To start blank, open a “Blank board” and choose “More tools” › “Org chart”, which places a card with “Name” and “Role” lines.
Fill in a card
Select it to open “Person properties”, then set “Name”, “Role” and “Color”.
Add people from the keyboard
Tab adds a report and Enter adds a peer, the same as “Add report” and “Add peer” in the panel. “Remove person” takes someone off.
Let it tidy itself
“Auto layout” in “Person properties” lines up the tree. Use it after a round of changes.
Add dotted lines by hand
With nothing selected, press L and draw from the report to the second manager. In “Line properties”, choose “Dashed” and set the end to “None”.
On Free a board holds 150 elements, and each card and line counts as one, so one chart fits about 75 people. A larger company needs Pro or Team, or a split across the 3 boards Free allows.
Start from a spreadsheet with AI
Export your sheet as CSV. Click “FlowDraw AI”, set “Diagram” to “Org chart”, attach the file with the ”+” button and write a prompt such as:
Org chart from this CSV. Show name and role on each card, and keep each manager’s reports together by team.
It costs 10 AI credits, plus at least 5 for the file, and opens as a new board of normal cards. Remove columns such as pay first. Nothing syncs from an HR system, so the owner still updates the chart by hand.
Share it with the people who need it
Who needs to read it decides how you share:
- Teammates: “Share”, then add people by email with “Can view”. A link set to “Anyone with the link” still asks people to sign in.
- Everyone on your intranet: the “Embed” tab in the same dialog, then “Copy code”. An embed opens with no account, is read-only, and shows the board as it is when the page loads.
- A printout or a slide: “Export” as PDF or PNG on any plan.
Org chart mistakes that cost trust
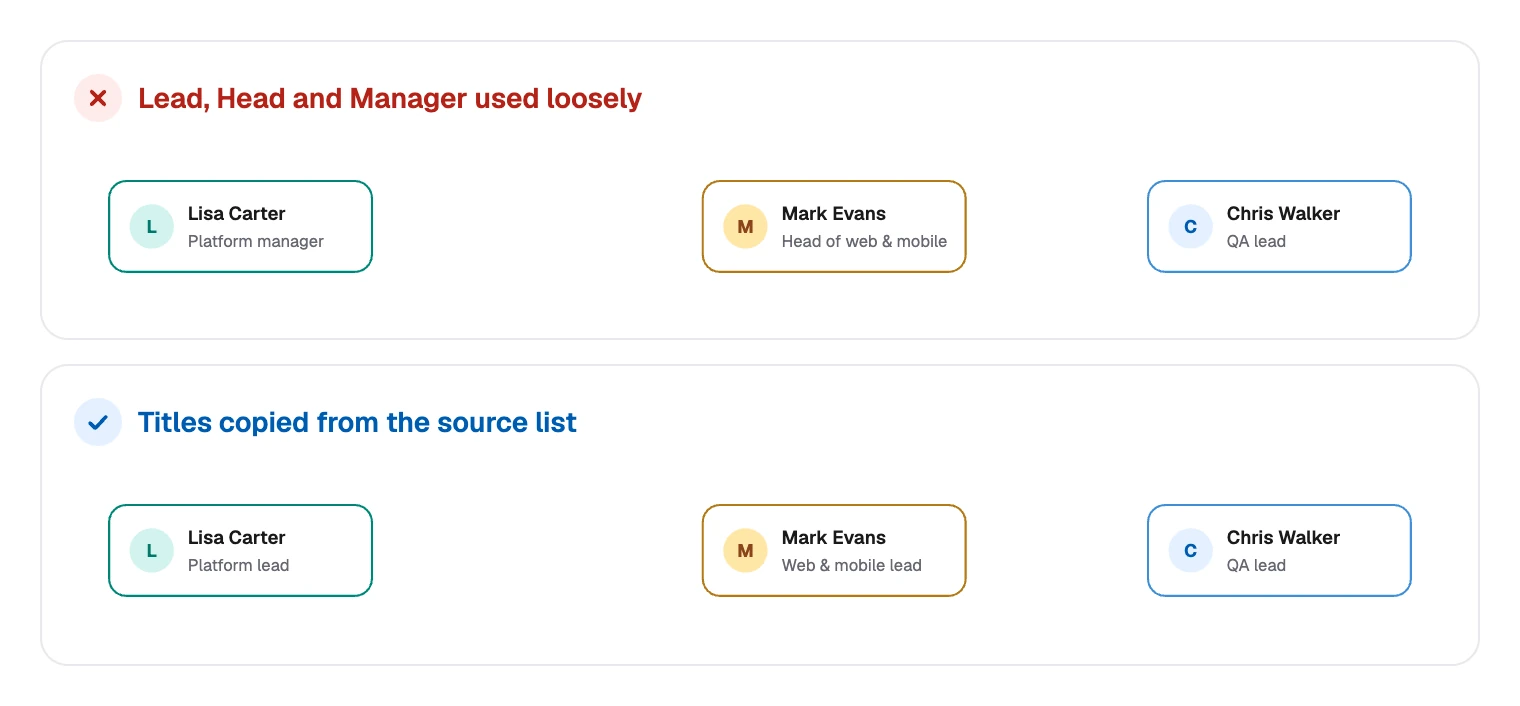
Titles nobody agreed on. “Lead”, “Head” and “Manager” used loosely will start arguments.
- Rank that wanders. A senior person drawn a row below their peers reads as a demotion, even when it was only a lack of space.
- Two solid lines into one card. A tree gives each person one manager. Make the second line dashed and say what it means.
- Private details on a shared board. Pay, performance notes and reasons for leaving do not belong on it.
- Using it to explain how work gets done. Reporting lines rarely match how a request travels through a company.
- No date. Without one, nobody can tell a current chart from one that is two reorganizations old.
If you have a list ready, create a free account and click the “Org chart” tile.
FAQ
At least each person's name and role, and a line to their manager. Add the team through grouping or color, mark open roles, and show the date it was last checked. Leave out anything private, such as pay or home addresses.