
How to make a PERT chart
A PERT chart maps tasks, estimates and the critical path. Learn the three-point formula, the forward and backward pass, and how to read a finish date.
The show opens on May 4 and the booth has to be there. Nobody knows how long the demo app will really take. A PERT chart turns that doubt into a finish date, and shows which tasks can’t slip.
Quick AnswerA PERT chart is a network of tasks with estimates. Give each task optimistic, most likely and pessimistic times, link tasks in order, then calculate each one’s earliest and latest dates. Tasks with no slack form the critical path, which sets the finish date.
What is a PERT chart?
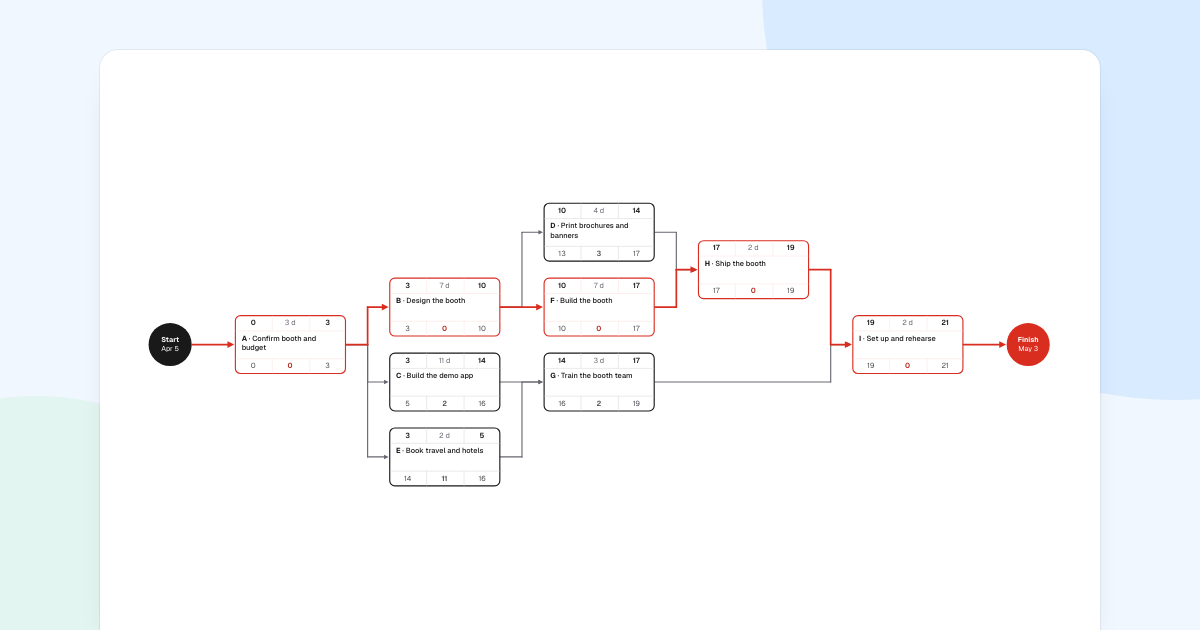
PERT stands for Program Evaluation and Review Technique. The US Navy developed it in the late 1950s for the Polaris missile program, where durations were hard to predict. The example plans a trade show booth.
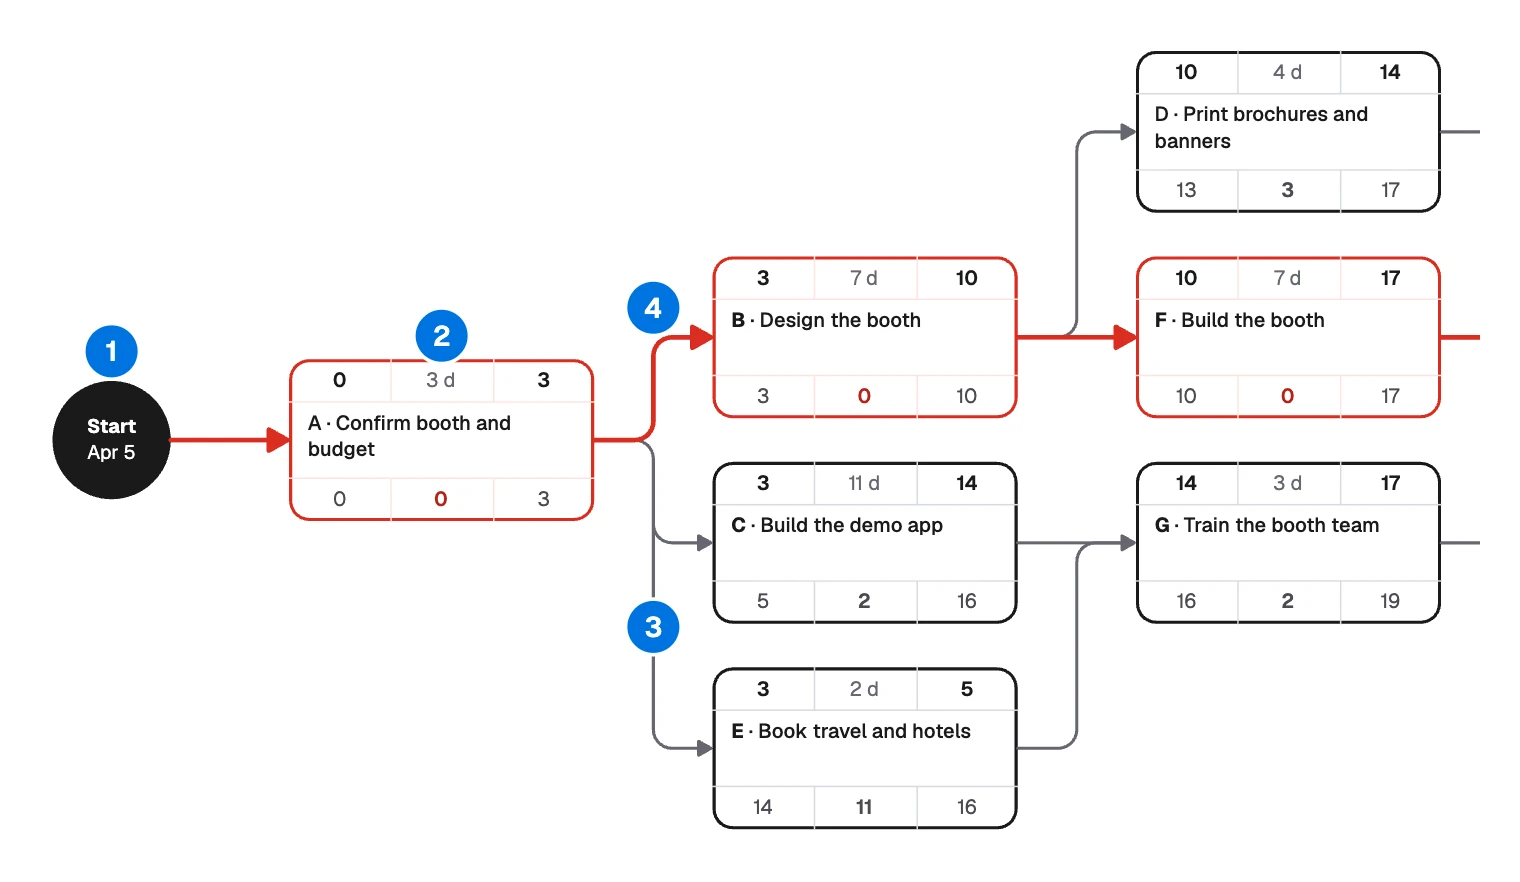
- Start and finish: the two ends of the network, here Apr 5 and May 3.
- Task: one box, with its dates inside.
- Dependency: an arrow from a task that must finish first.
- Critical path: the red route, where any delay moves the finish.
Older PERT charts drew tasks on the arrows. Today most, like this one, put them in boxes.
Use one when durations are uncertain and many tasks run side by side. For tracking dates week by week, a Gantt chart is easier to read.
How to make a PERT chart
Estimate each task
Start with a task list, such as the work packages from a work breakdown structure. Ask the person doing each task for three numbers, in the same unit.
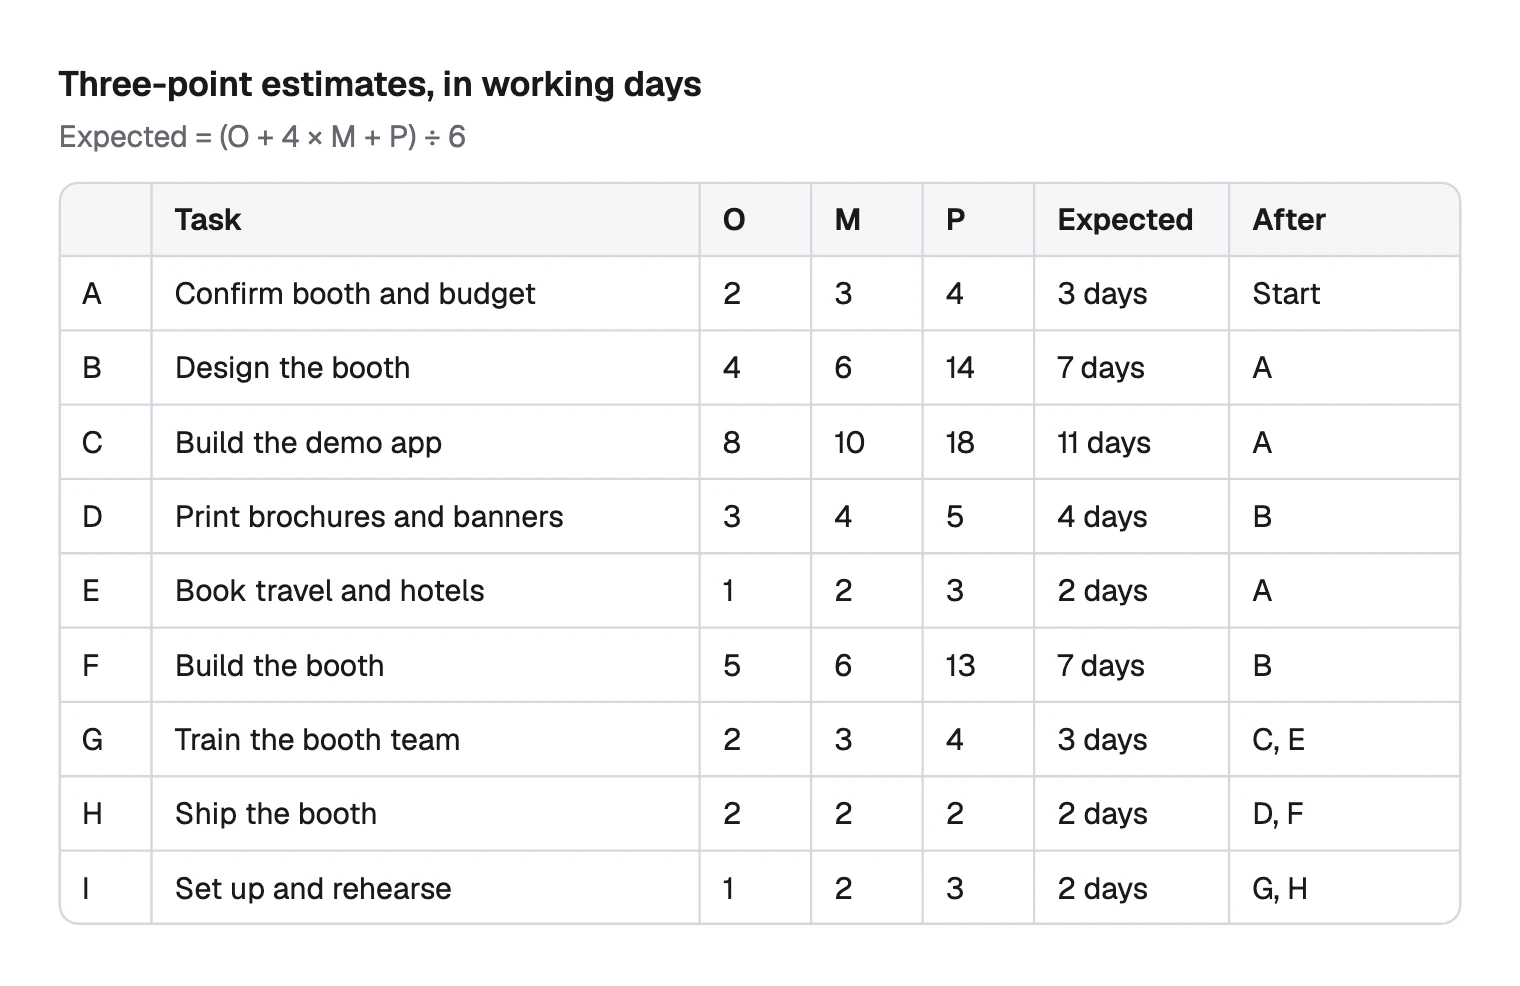
- O, optimistic: the time if things go unusually well.
- M, most likely: the time you would bet on.
- P, pessimistic: the time if things go badly.
The formula pulls the answer toward the likely case but keeps the risk. “Design the booth” has a likely time of 6, yet (4 + 4 × 6 + 14) ÷ 6 gives 7, because its bad case is so long.
Link the tasks
For each task, ask what must be finished first, and write that in the “After” column. Then draw an arrow for each entry. “Train the booth team” comes after both C and E, so two arrows meet there. The network must not loop back.
Do the forward and backward pass
Each box has six numbers, with the earliest dates on top and the latest below:
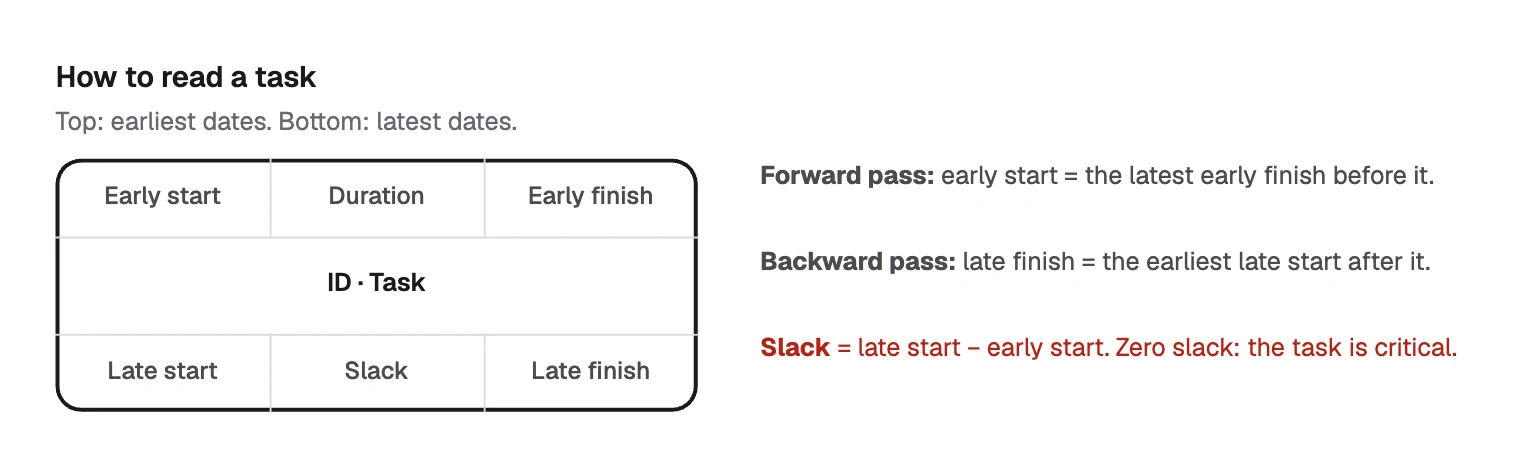
Go forward from day 0 and add each duration. When arrows meet, take the latest finish, because the task waits for everything before it. So G starts on day 14, when C is done, even though E finishes on day 5.
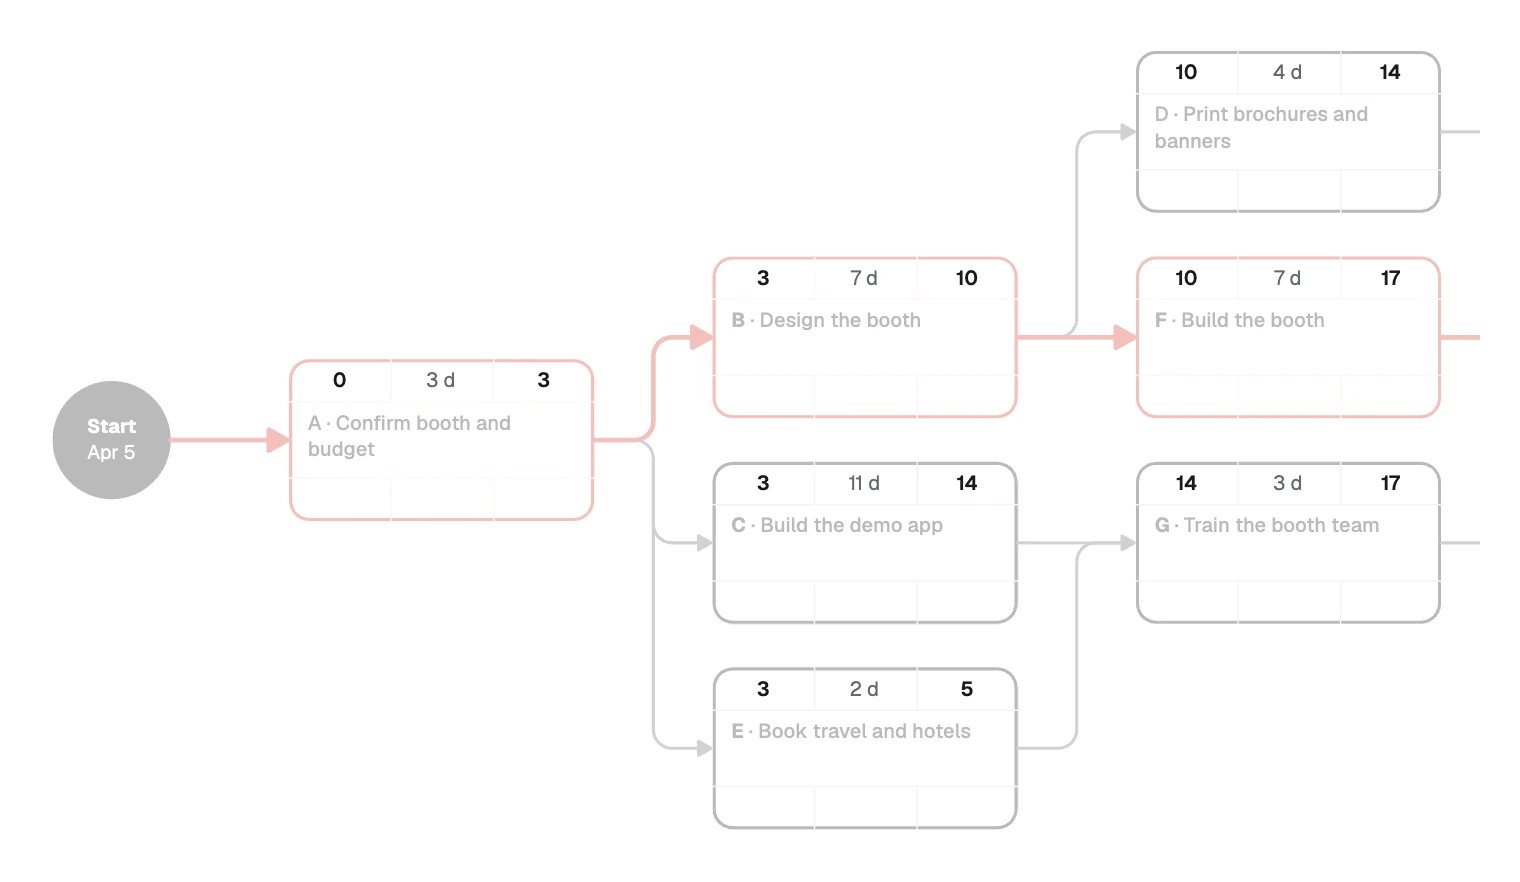
Then go backward from the finish, day 21, and subtract. When arrows split, take the earliest start of what follows. Slack is the difference between late and early start.
Find the critical path
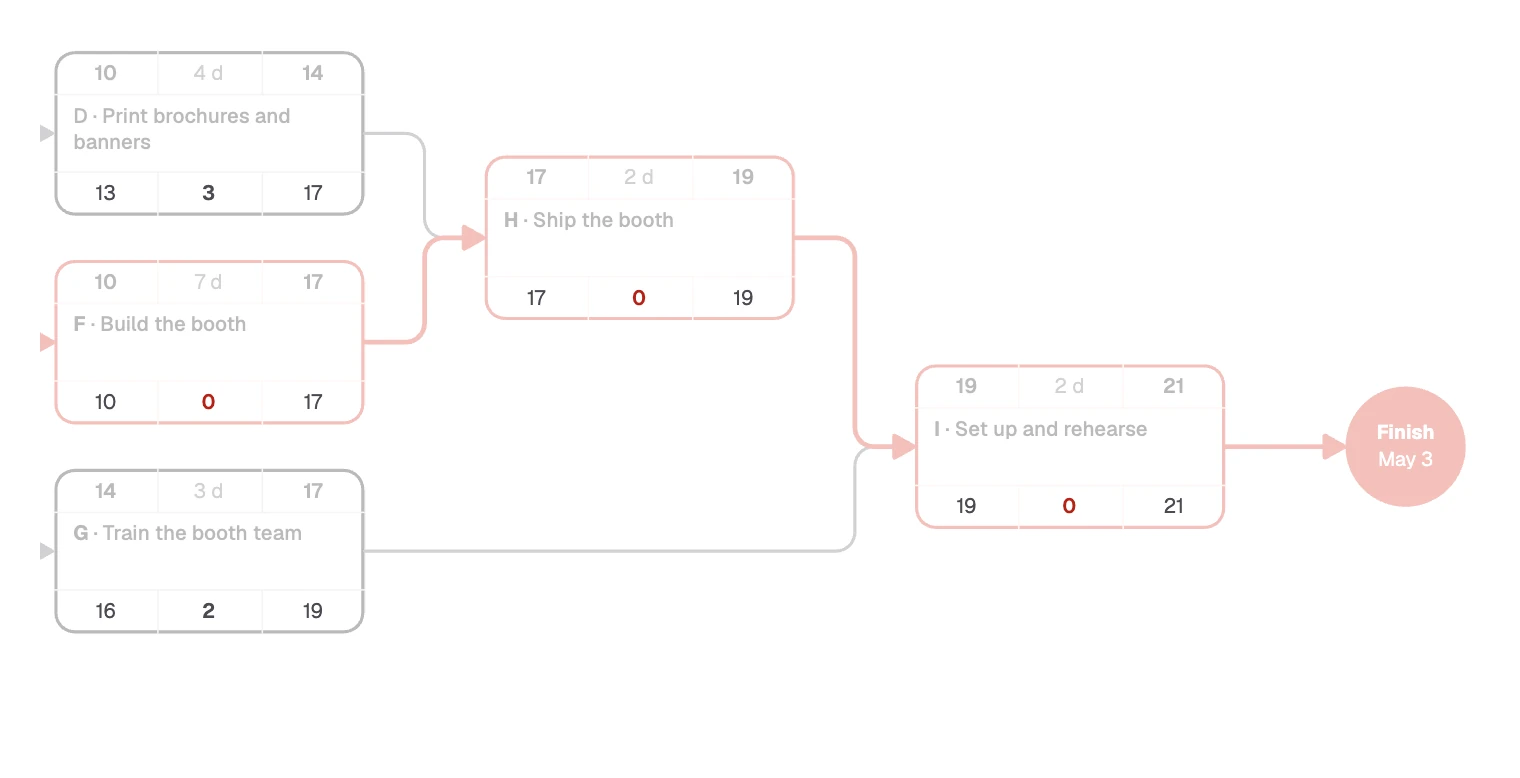
Follow the tasks with zero slack: A, B, F, H and I. They add up to 3 + 7 + 7 + 2 + 2 = 21 working days, which runs Apr 5 to May 3.
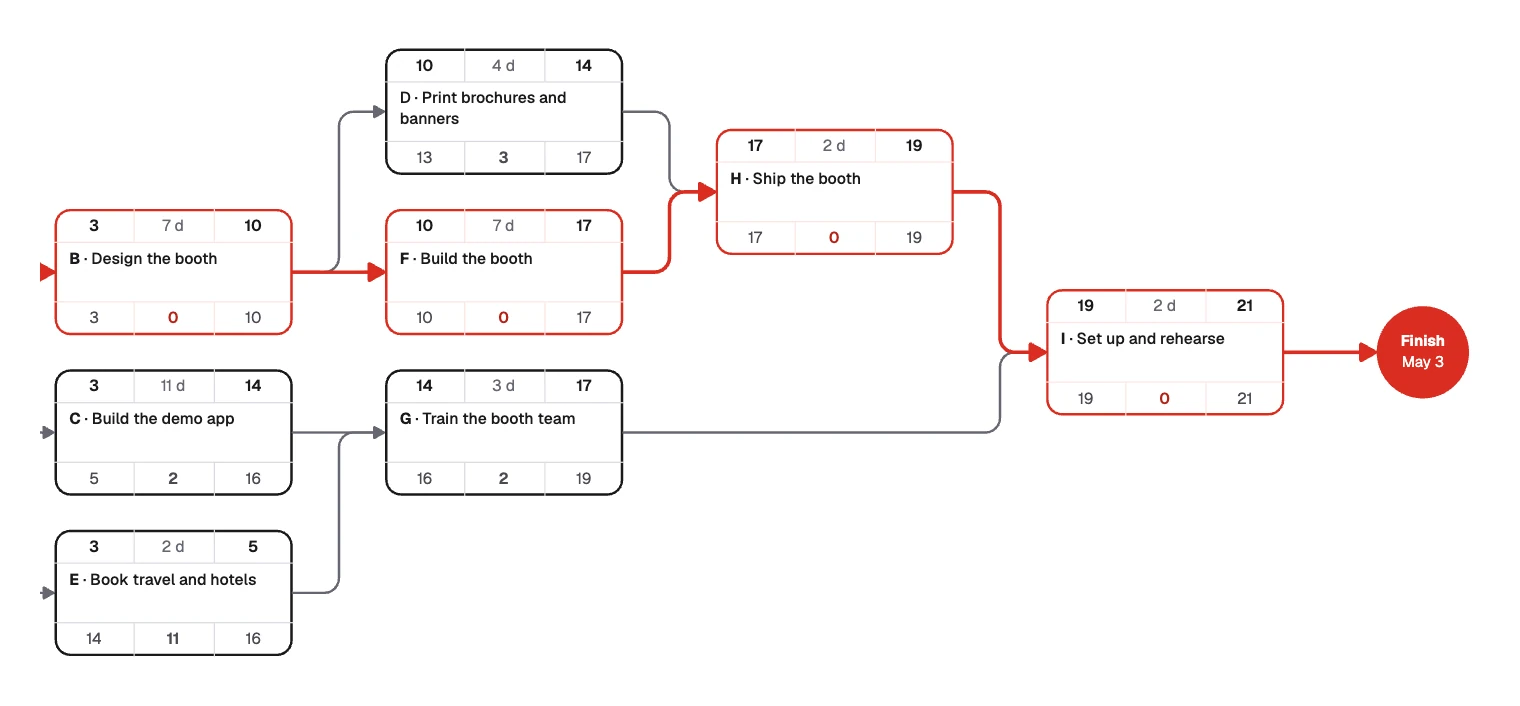
This tells you where effort pays off. Speeding up “Book travel and hotels”, with 11 days of slack, gains nothing. A day saved on “Build the booth” moves the finish, until another path becomes the longest.
What is the chance of finishing on time?
PERT also estimates spread. Each task’s standard deviation is (P − O) ÷ 6, and you combine those along the critical path. The board gets σ = 2.2 days, and “B adds the most doubt”. Finishing by day 24 comes out at about 91%.
Treat that as a rough guide. It looks only at the critical path, while C and G have just 2 days of slack and could overtake it. The real chance is a little lower.
Note also that a finish on May 3 leaves no margin before the show opens on May 4.
Drawing a PERT chart in FlowDraw
The template is free, in the Project management category.
Open the template
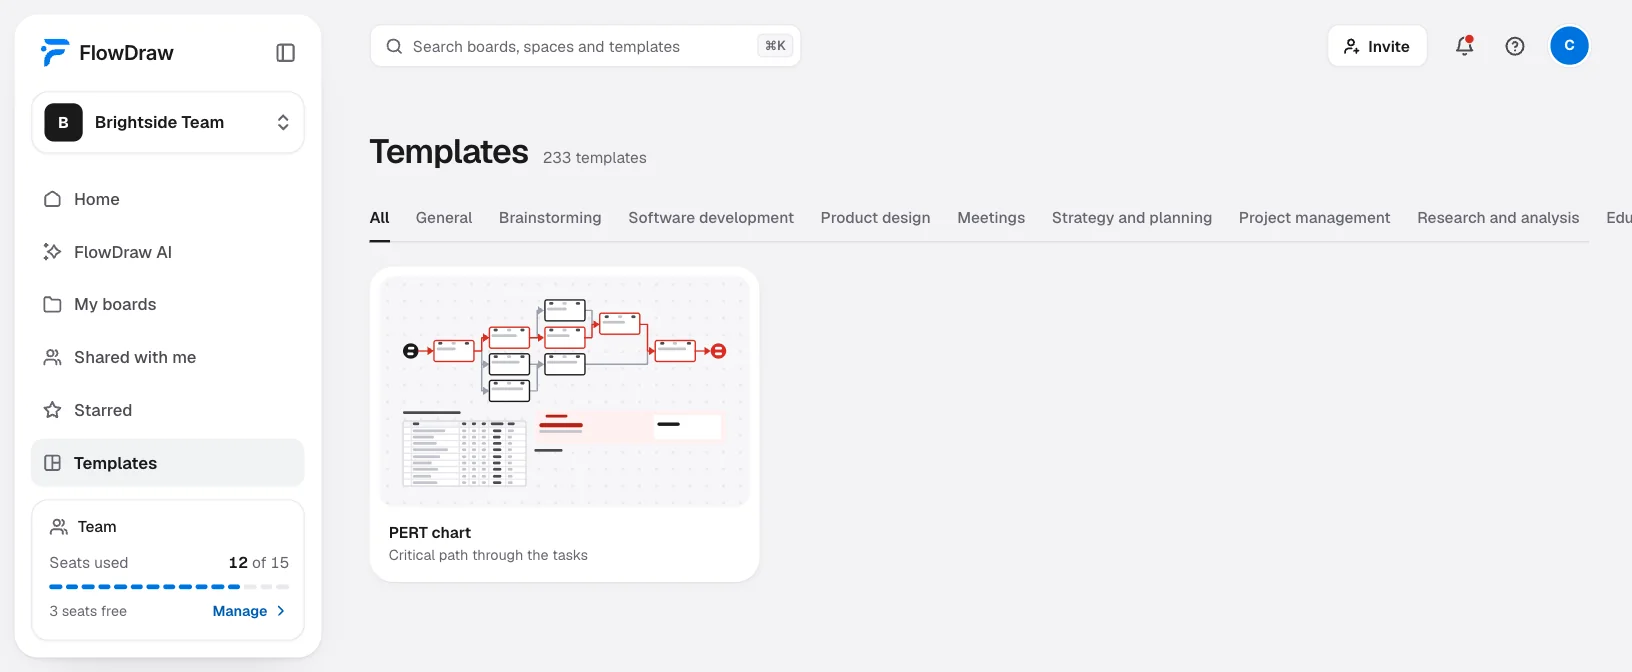
Search for “PERT chart” under “Templates”, open the card, then choose “Use template”.
Retype the estimates
Double-click a table cell or any number in a box and type. Every number is plain text, so FlowDraw does no sums. Work them out by hand or in a spreadsheet, then type them in.
Add a task
Drag from an empty part of the board around a whole task box, which selects its 15 elements. Press ⌘D (Ctrl+D on Windows), drag the copy into place and retype it.
Link it
Press Esc, then L, and drag from one box to the next. The arrow stays attached when you move a box.
Mark the critical path
Click an arrow and pick red with “Line color” in “Line properties”. Click a task’s box and use “Stroke color” in “Shape properties”.
Share the result
Choose “Share” and add people, or use the “Embed” tab for a read-only copy that needs no account. “Export” gives you PNG, SVG, PDF or JSON.
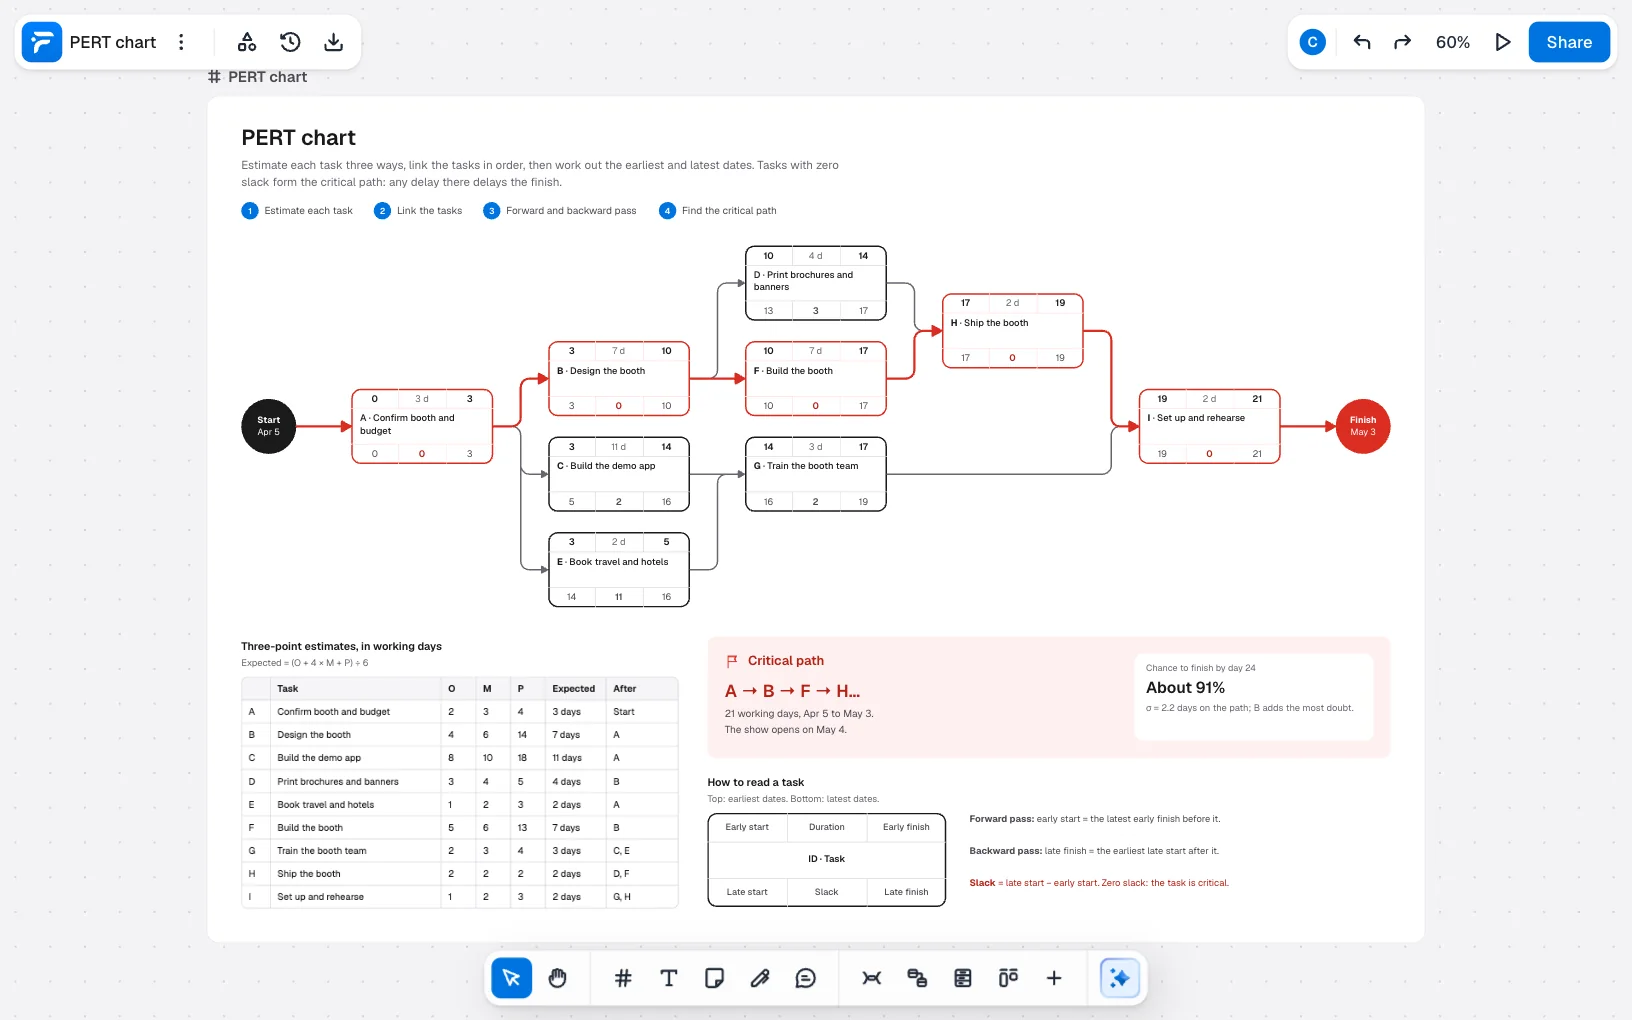
On Free, this board has 198 elements and Free holds 150. It opens whole and you can change every word, but adding anything is refused until you are under 150.
Deleting the title block, “How to read a task”, the critical path panel and one task box does it. Pro has no limit.
PERT chart mistakes to avoid
- Three numbers that are really one. If O, M and P are close by habit, you lose the point. Ask what could go wrong.
- Padding the most likely time. It counts four times in the formula, so the padding counts four times too.
- Taking the earliest finish where arrows meet. The task waits for the last one, not the first.
- Watching only the red path. A task with little slack, such as C here, can take over.
- Reading 91% as a promise. It is only as good as the estimates behind it.
- Never redoing the sums. When an actual time comes in, run both passes again.
FAQ
O is the optimistic estimate, if things go unusually well. M is the most likely. P is the pessimistic estimate, if things go badly. The expected time is (O + 4 × M + P) ÷ 6.