
How to draw an ER diagram for your database
Draw an ER diagram for your database step by step, with entities, keys and crow's foot cardinality explained through a five-table orders schema you can copy.
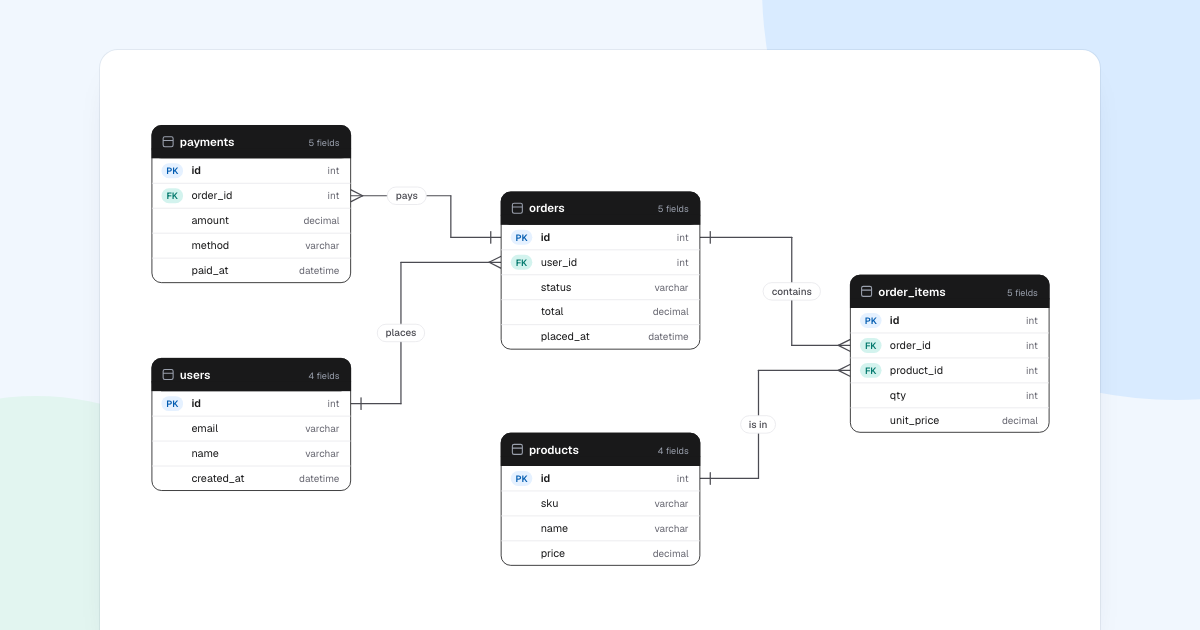
The quickest way to test a database design is to draw it before anyone writes a migration. To draw an ER diagram that does that job, you need to read the marks on its lines, so we begin with a small orders schema.
Quick AnswerAn ER diagram shows the tables in a database, their key fields, and how rows in one table relate to rows in another. To draw one, list your entities, give each a primary key, write each relationship as a sentence, then add foreign keys and cardinality to both ends of every line.
How to read an ER diagram
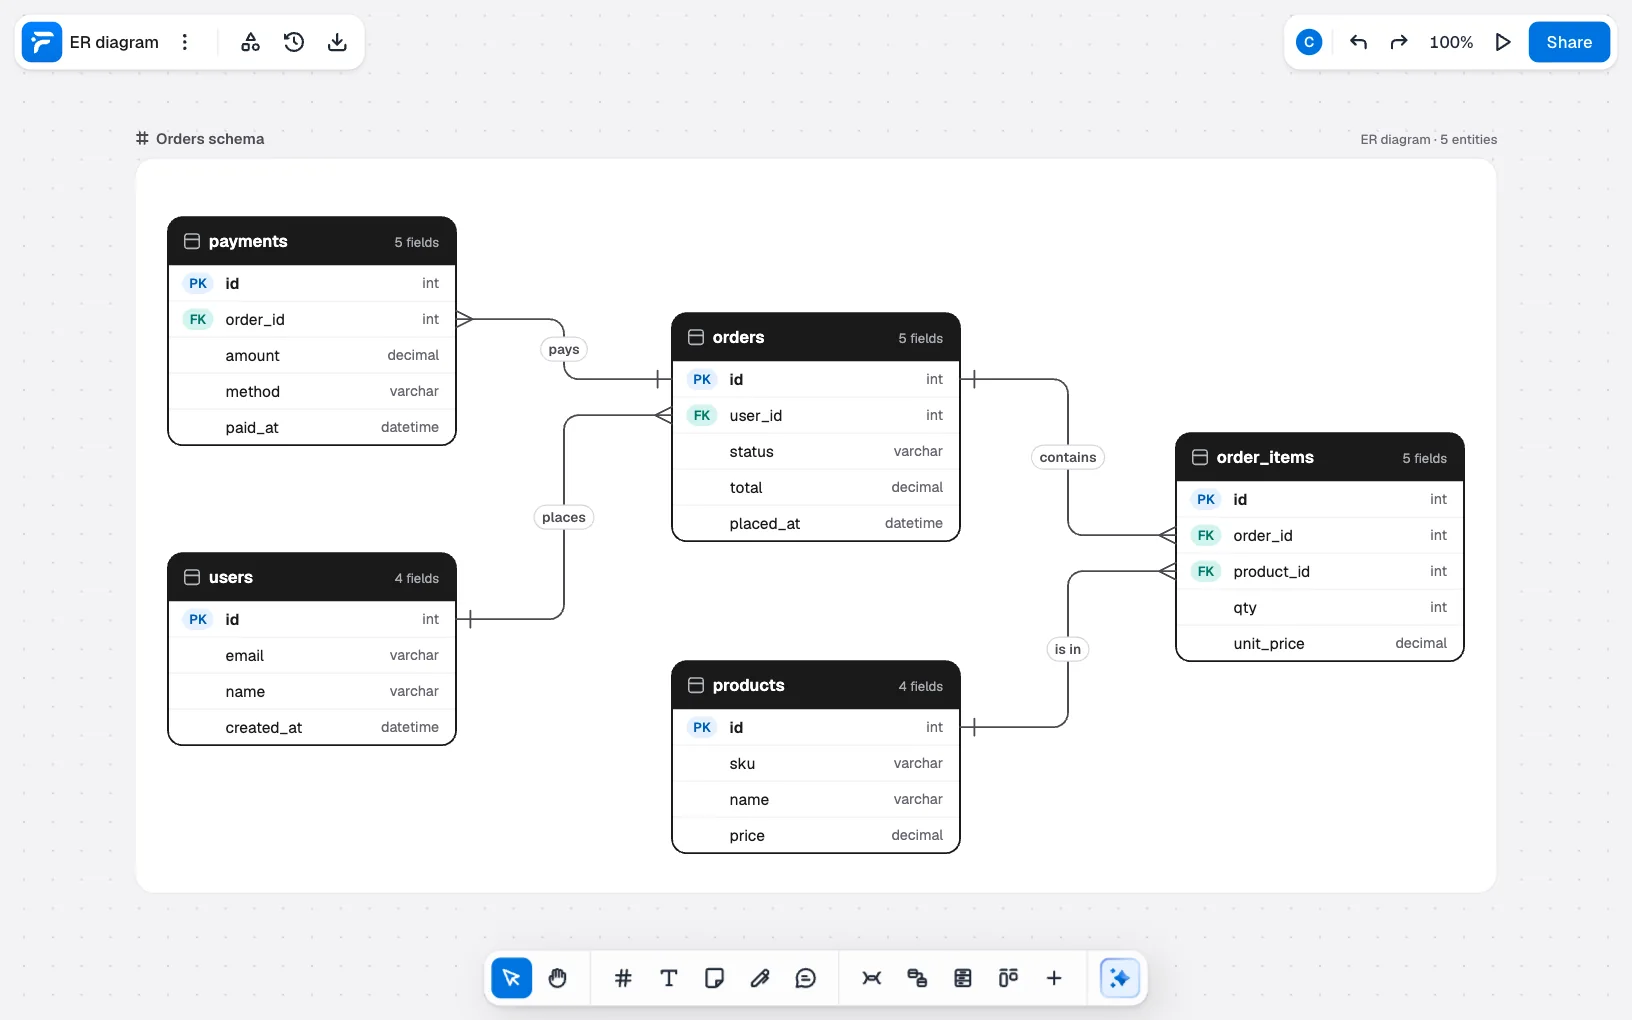
This orders schema has five tables and four lines.
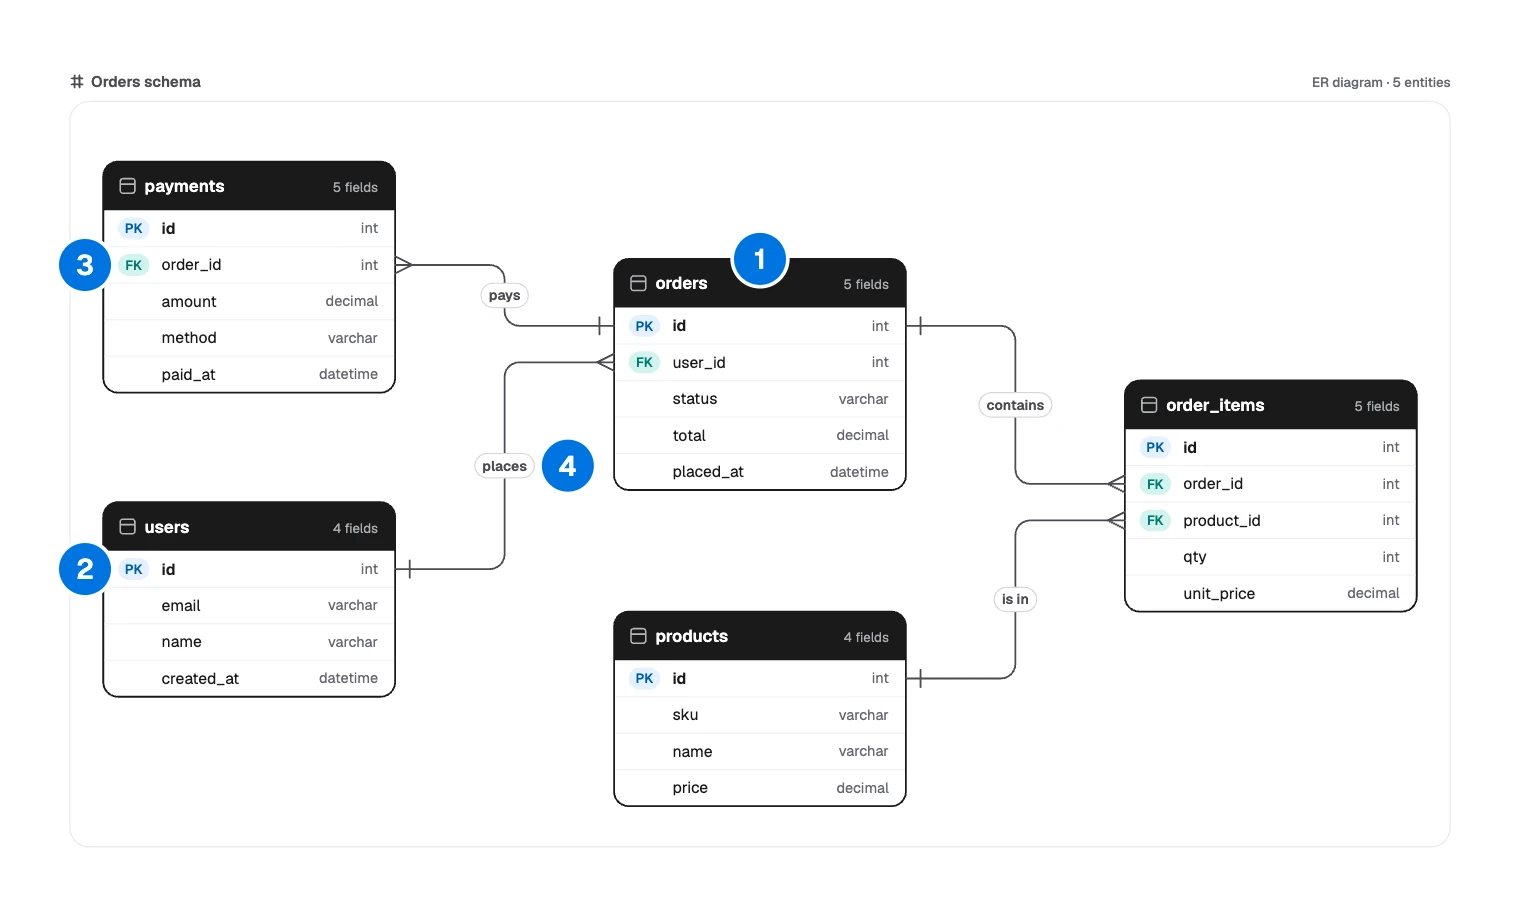
- Table: one entity, with a row per field.
- Primary key:
PKmarks the field that identifies a row. - Foreign key:
FKmarks a field that points to a row in another table. - Line: a relationship, named with a verb.
Each line is a sentence you can say out loud:
| Line | Sentence | Where the key lives |
|---|---|---|
| places | One user places many orders | orders.user_id |
| pays | Many payments pay one order | payments.order_id |
| contains | One order contains many order items | order_items.order_id |
| is in | One product is in many order items | order_items.product_id |
Three choices explain its shape:
- The foreign key sits on the “many” side. An order stores its
user_id, because one column cannot hold a list of order IDs. order_itemsis a join table. One order holds many products and one product appears in many orders, so each pair gets a row.unit_pricelives on the item. It copiesproducts.priceat the time of sale, so changing a price next month does not rewrite last month’s orders.
What is an ER diagram?
An entity relationship diagram, or ERD, is a map of what a system stores. Teams draw them at three levels:
- Conceptual: entities and relationships only, for talking with people outside engineering.
- Logical: adds attributes and keys, without tying them to one database.
- Physical: real table names, column types and foreign keys, as on this board.
Draw one before a new feature or a migration, when an engineer joins, or when two services disagree about who owns what. If you are modeling code rather than stored data, a UML class diagram fits better.
ER diagram symbols: crow’s foot notation
Most database teams use crow’s foot notation.
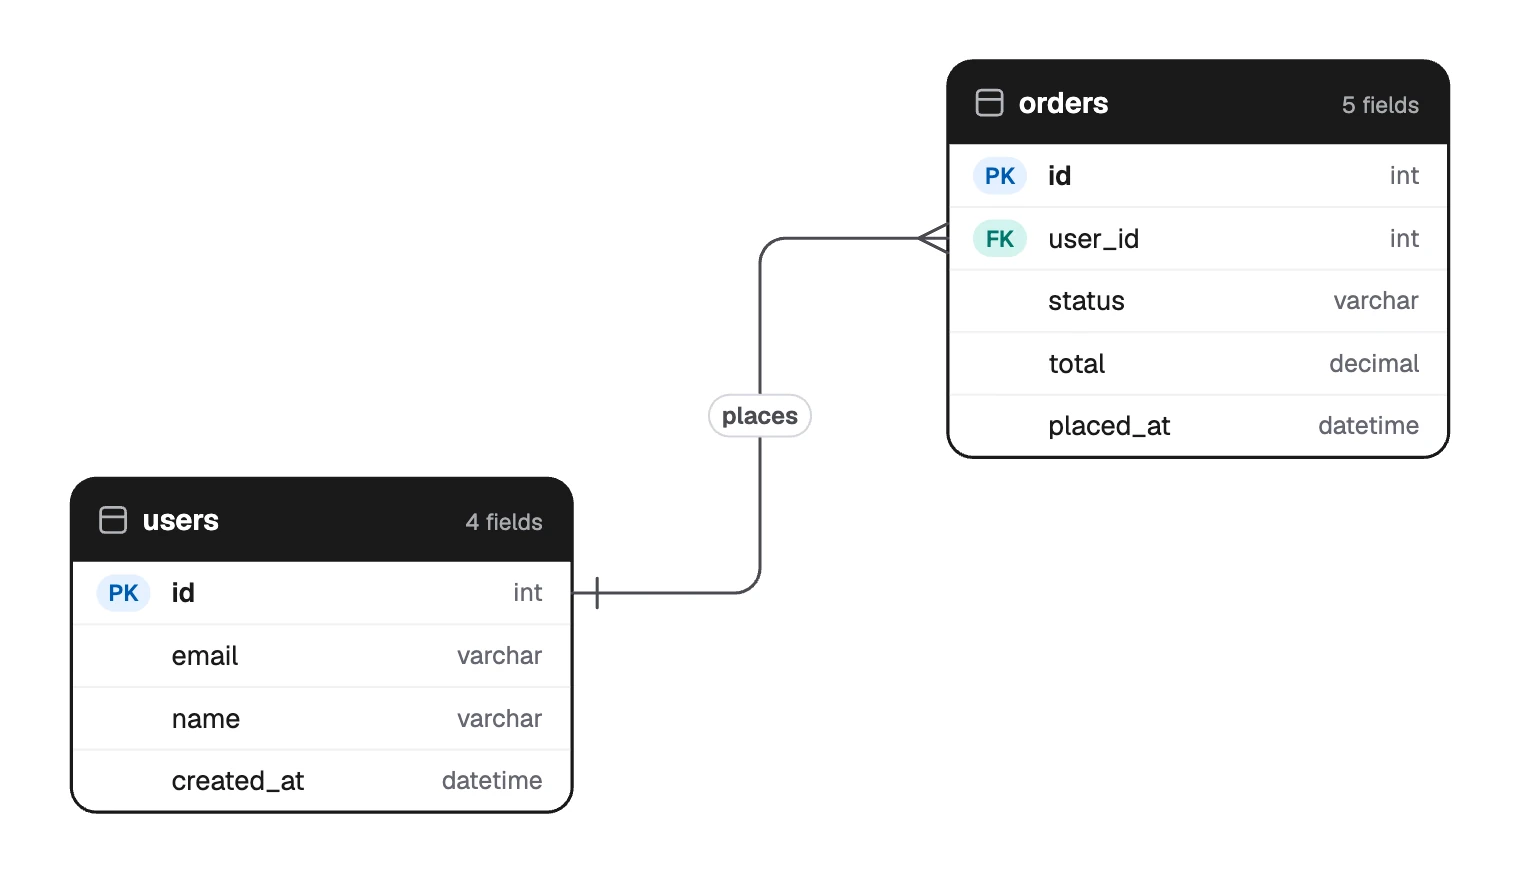
The marks at each end of a line give the cardinality: how many rows on that side can match one row on the other.
| Cardinality | Mark at the end of the line | Meaning |
|---|---|---|
| One | One bar | One row |
| Only one | Two bars | Exactly one, required |
| Zero or one | Circle and bar | Optional, at most one |
| Many | Crow’s foot | Many rows |
| One or many | Bar and crow’s foot | At least one |
| Zero or many | Circle and crow’s foot | Any number, including none |
The orders schema uses plain “One” and “Many” to stay simple. When optionality matters, be exact: if a new order may have no payment yet, the payments end should read “Zero or many”.
Chen notation is the older alternative, with rectangles for entities, diamonds for relationships and ovals for attributes. It suits teaching but takes a lot of room. FlowDraw has a “Chen ER diagram” template, also on Pro.
How to draw an ER diagram
Find the entities. Underline the nouns the system must remember: users, orders, products, payments. Properties such as a price become fields, not tables.
Give each one a primary key. A plain
idis fine. Then add the fields that explain the design.Write the relationships as sentences, both ways. A user places many orders, and an order belongs to one user. Can a user have no orders? The answers set your marks.
Every line has a verb and two marks Place the foreign keys. In one-to-many, the key goes on the many side. In one-to-one, it goes on the side that depends on the other. Many-to-many needs a join table.
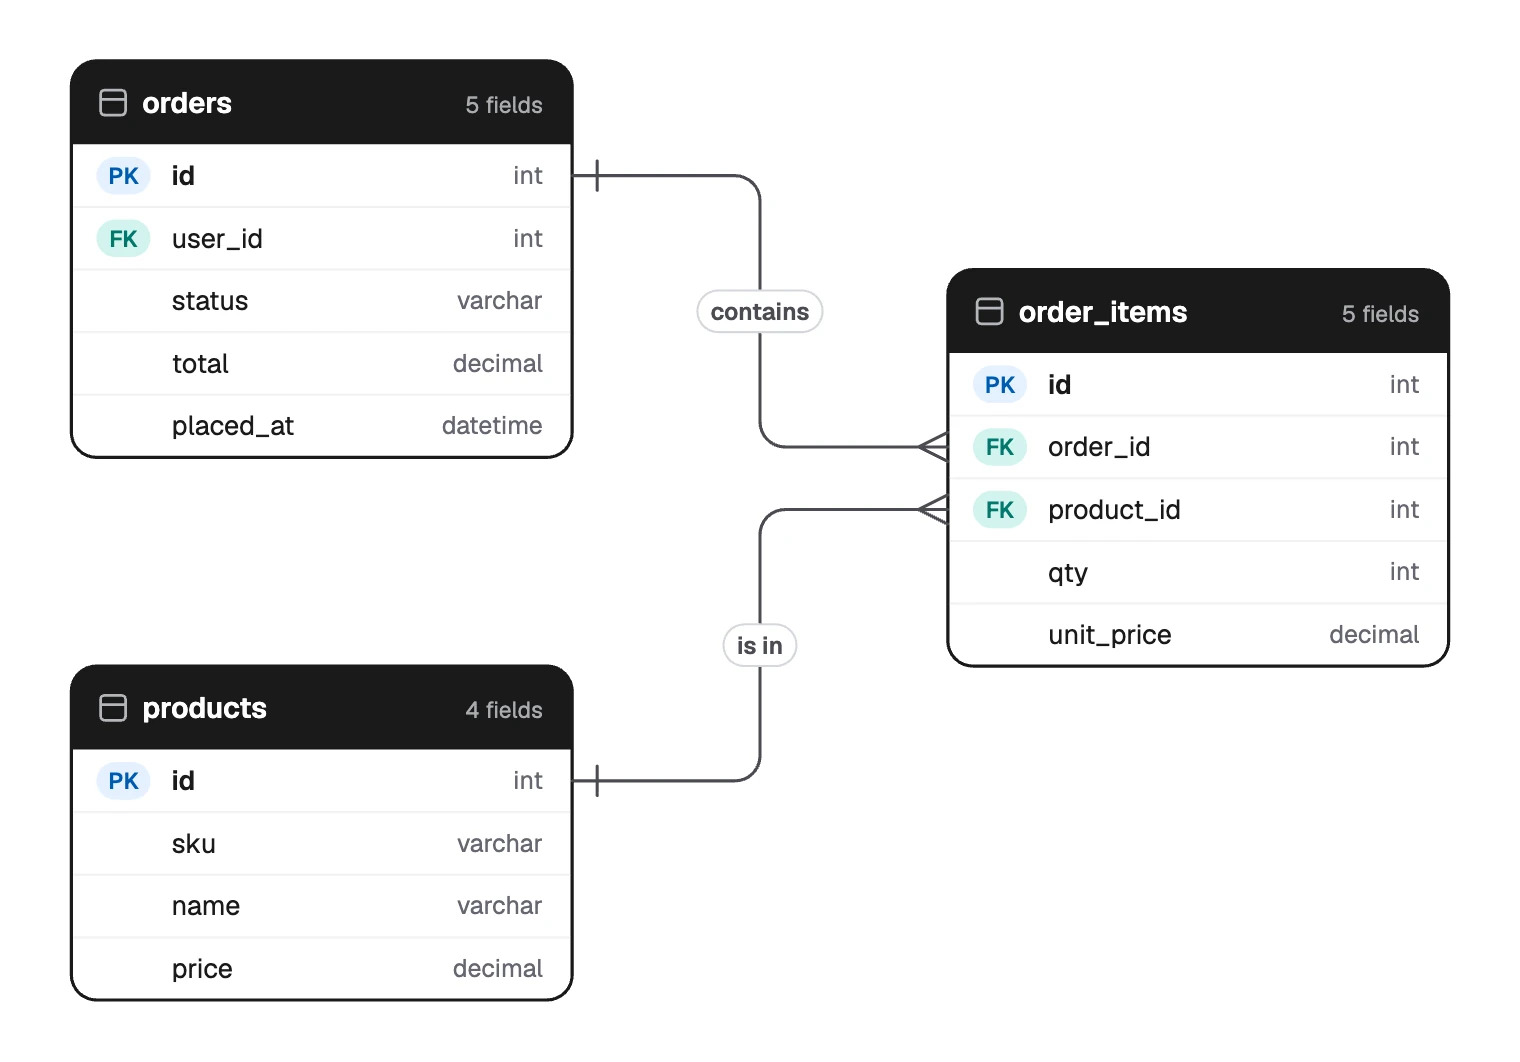
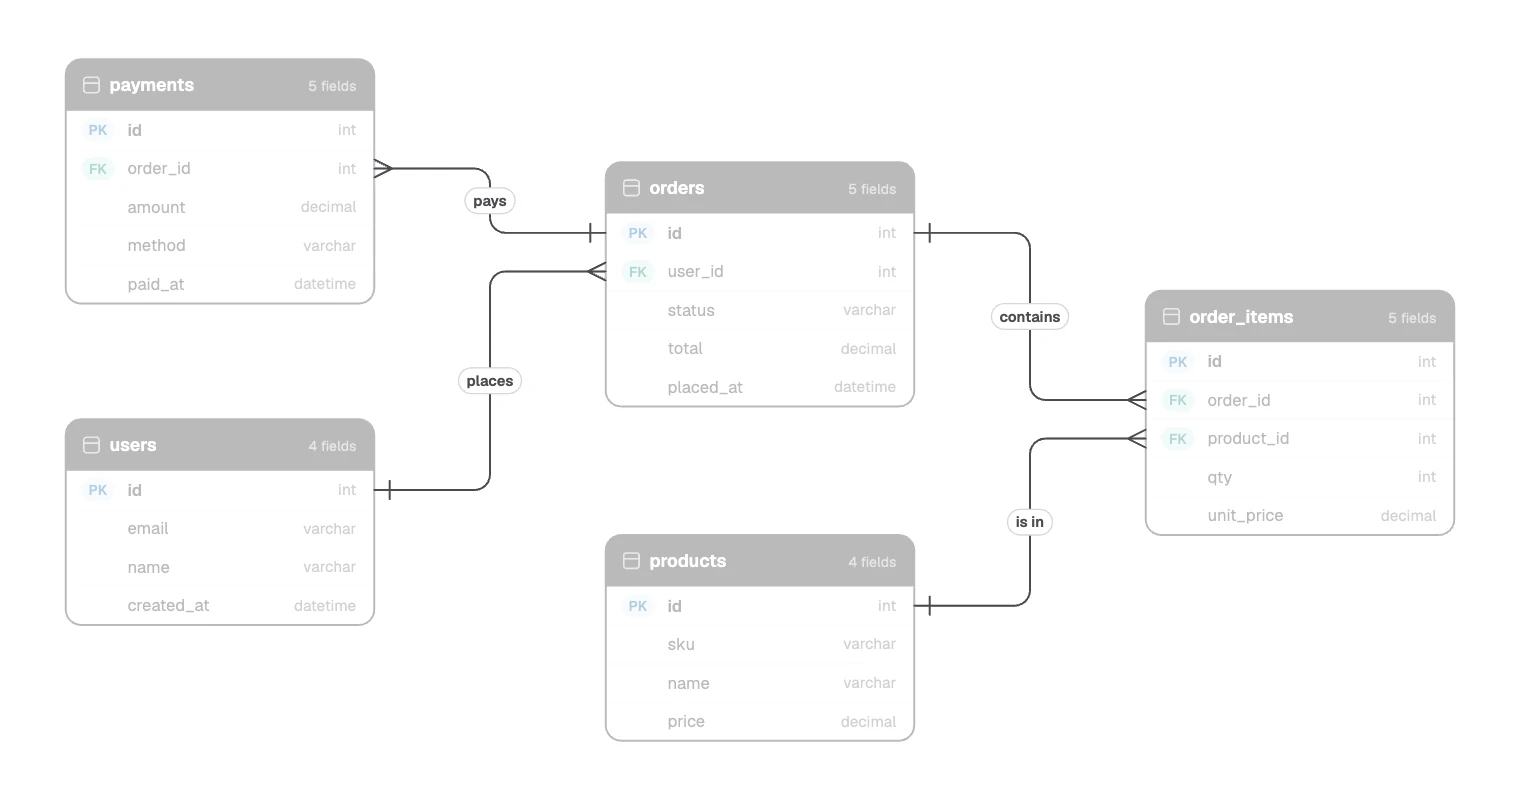
A join table turns many-to-many into two lines Test it with real questions. “What did this customer buy last month?” should trace from
userstoproductswithout a gap. If you cannot trace a path, a relationship is missing.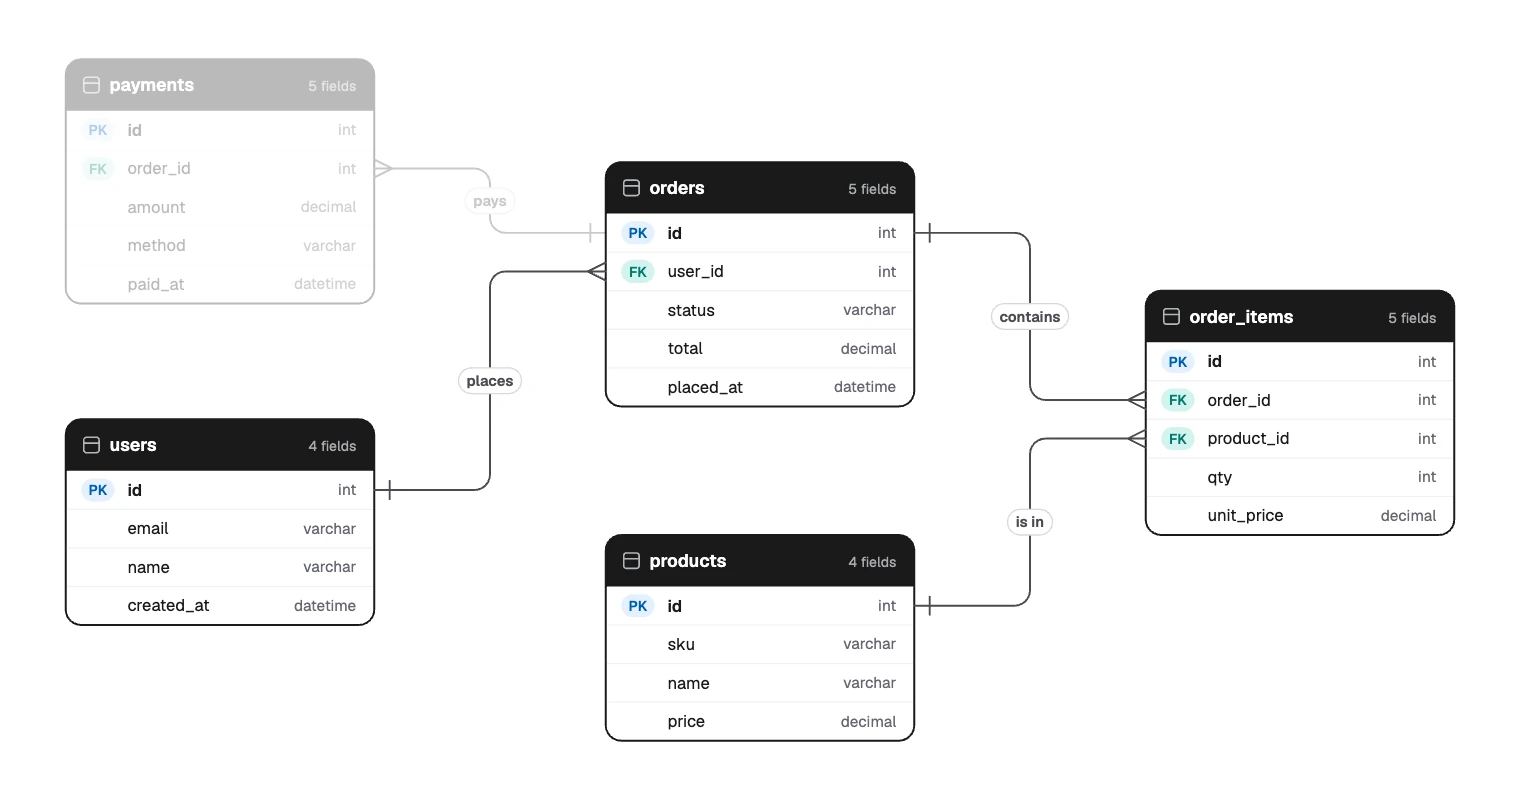
The path from a customer to what they bought
Draw your ER diagram in FlowDraw
ER diagrams come with Pro or Team. On Free, the template and tools open an upgrade dialog.
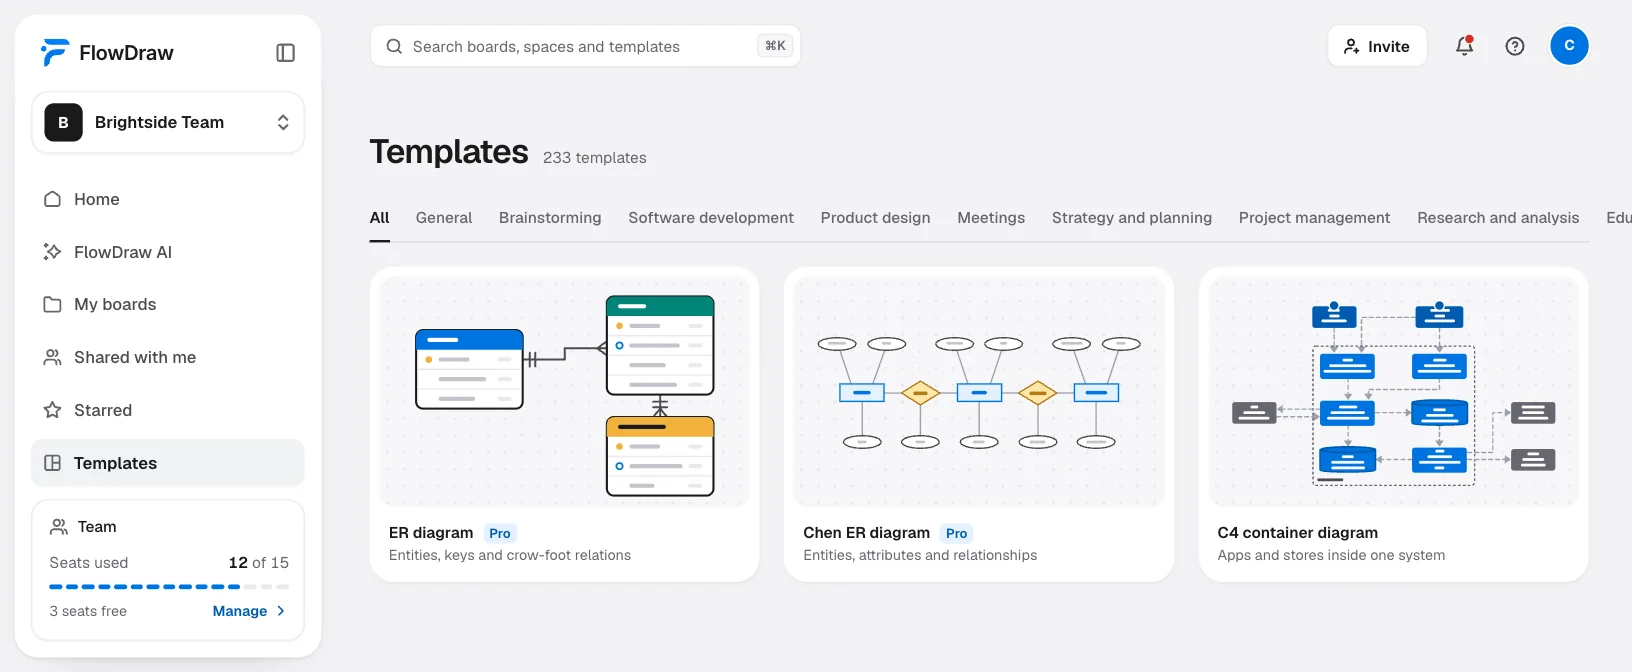
Start the board
On Home, click the “ER diagram” tile, or search for it under “Templates” and click “Use template”. To start blank, click “ER diagram” in the dock of a “Blank board”.
Define the fields
Select a table to open “Entity properties”. Give each field a key (“PK” or “FK”), a name and a type: int, bigint, varchar, text, boolean, decimal, date or datetime. “Add field” adds a row.
Connect the tables
With nothing selected, press L and drag from one table to another. Select the line and set “Cardinality” for each end. Double-click the line to label it with a verb.
Tidy the layout
“Auto layout” in “Entity properties” arranges the whole diagram.
Review it
Click “Share” and invite people with “Can comment”, so they can pin questions to a table. “Export” gives you SVG or PDF for the design doc.
On Free, use “Table” from “More tools”, with a row per field. Lines attach to tables, and “Ends” in “Line properties” offers the same “One”, “Many” and other marks. Write keys and types into the cells.
With AI, on Pro or Team, click “FlowDraw AI” and set “Diagram” to “ER diagram”. Describe the data, or paste your CREATE TABLE statements:
ER diagram for an online store. Users place orders, orders contain order items, each item points to one product, and an order can have several payments. Show primary keys, foreign keys and field types.
Check the cardinality afterwards, because prose rarely says what is optional. The board is not connected to your database, so update it with each migration.
Common ER diagram mistakes
- A many-to-many line with no join table. It looks tidy, but no relational database can store it as drawn.
- The foreign key on the wrong side. If
usersholdsorder_id, each user can have only one order. - Marks at one end only. That leaves half the rule unsaid.
- Lists in a field. A
tagscolumn holding comma-separated values is a missing table. - Mixed naming.
Order,usersandproduct_itemmake every query a guess. - A diagram that drifts. Change it in the same pull request as the schema.
New here? Create an account and try the same layout with tables.
FAQ
A schema is the actual definition of the tables in a database. An ER diagram is a picture of it, or of a design for it. A physical ER diagram matches the schema closely, while a conceptual one leaves out keys and types.