
How to make a Gantt chart
Learn how to make a Gantt chart: list the tasks, set dates and owners, link dependencies and track progress, then edit a free template in FlowDraw.
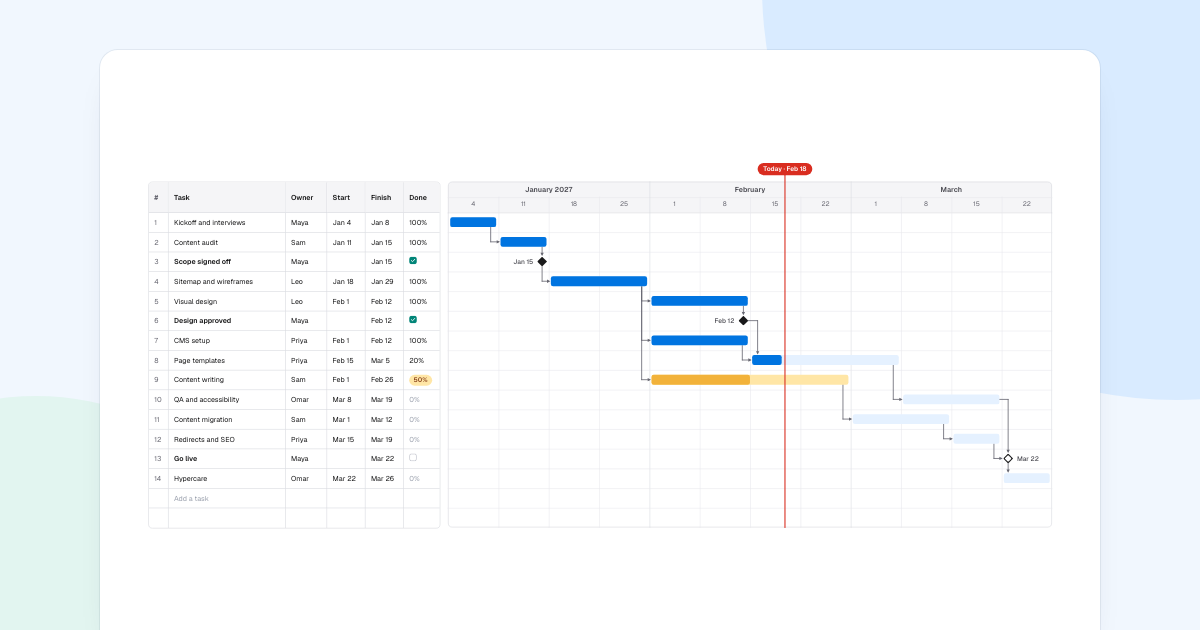
A website relaunch has 14 tasks, five people and a go-live date everyone has promised. A Gantt chart puts all of that on one page, so you can see what is late and what it will hold up.
Quick AnswerA Gantt chart lists tasks down the side and time across the top, with a bar for each task’s dates. To make one, list the tasks, give each dates and an owner, draw an arrow from each task that must finish first, then update progress every week.
What is a Gantt chart?
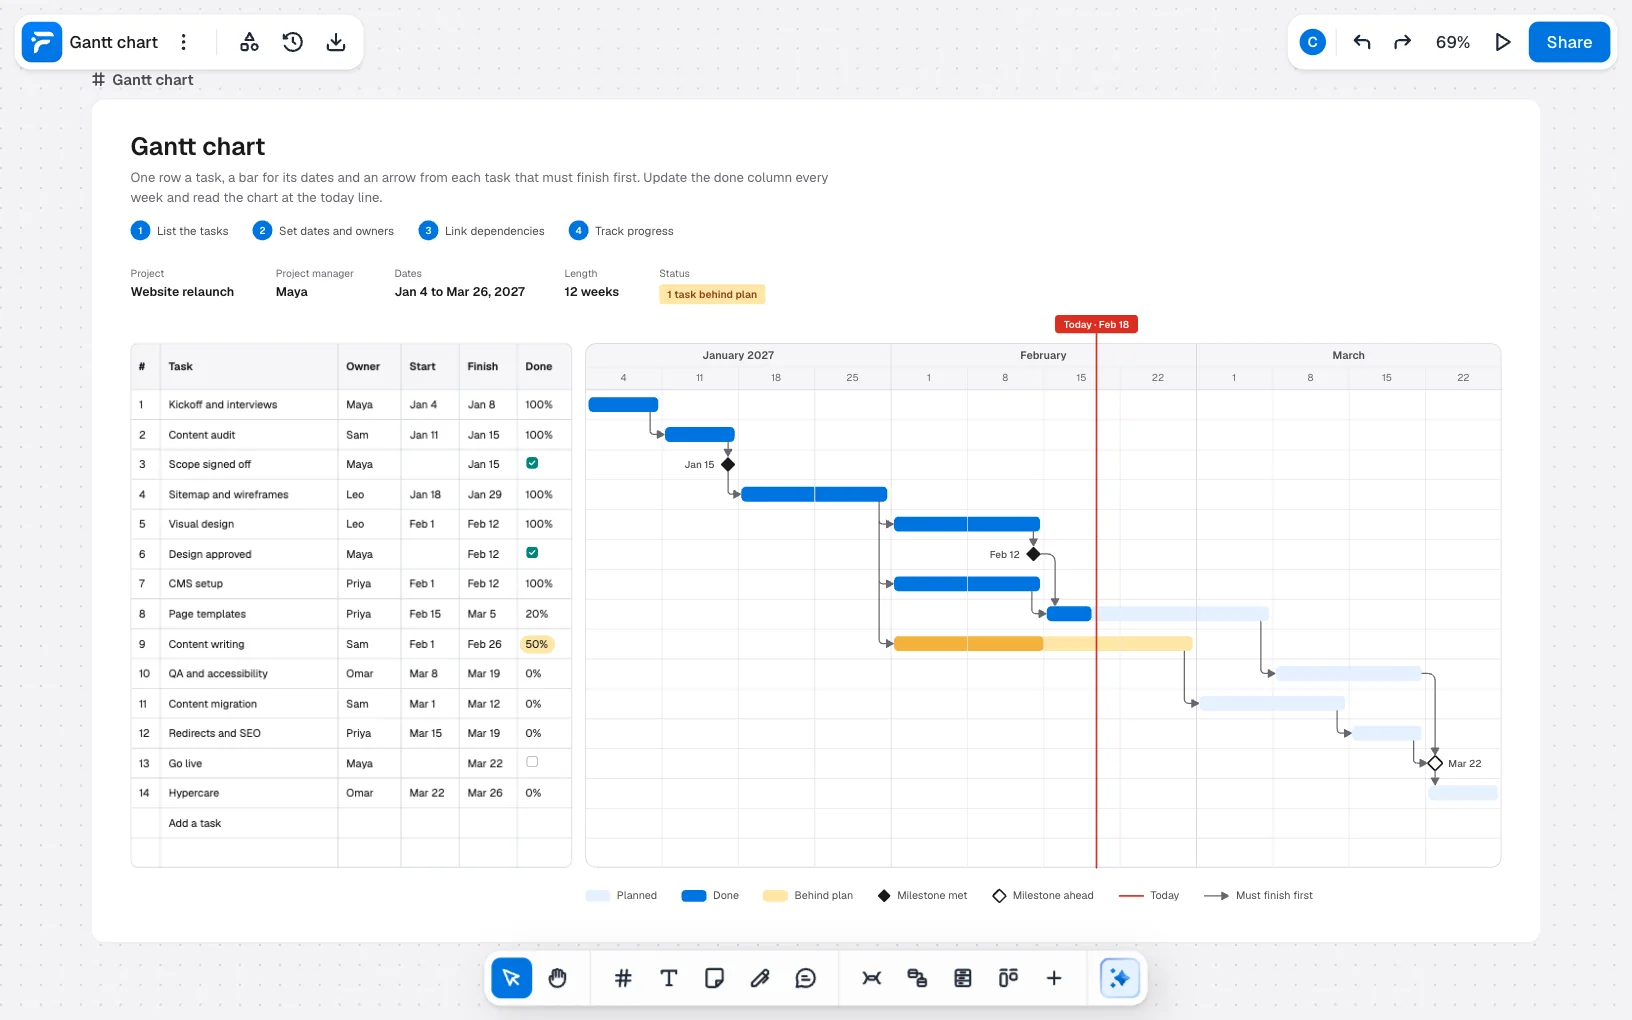
It is a bar chart of a schedule, named after Henry Gantt, who popularised it in the 1910s. The example here is a Website relaunch run by Maya, from Jan 4 to Mar 26, 2027.
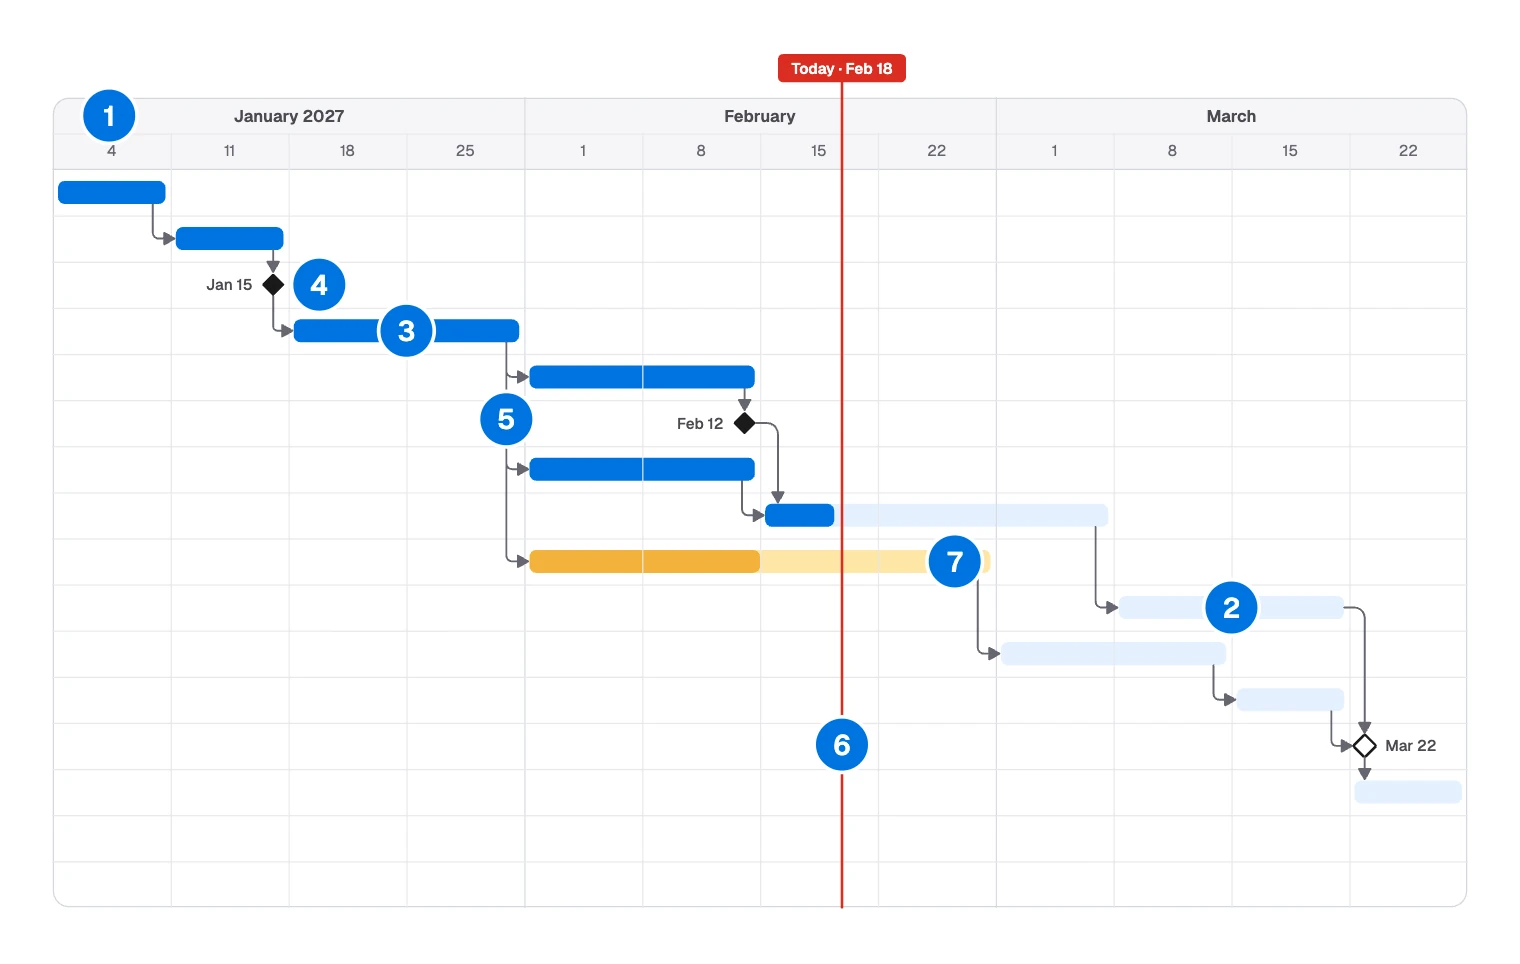
- Time scale: months above, weeks below.
- Planned bar: one task, from its start to its finish.
- Done: the darker part of a bar is the work finished.
- Milestone: a diamond with no length, such as “Scope signed off” on Jan 15.
- Dependency: an arrow from a task that must finish first.
- Today line: where you are now.
- Behind plan: a bar in a warning colour.
When a Gantt chart is the right tool
Use one when tasks depend on each other and the end date matters. Otherwise something lighter will do.
| Your situation | Better fit |
|---|---|
| Tasks overlap and wait for each other | Gantt chart |
| Leaders only need the key dates | Project timeline |
| Work arrives steadily, with no fixed end | Kanban board |
| Nobody knows yet how long the tasks will take | PERT chart |
How to make a Gantt chart
List the tasks
Start from what must be delivered, not from the calendar. If the list is long, break the project down with a work breakdown structure first. Keep tasks at a size you would check on weekly.
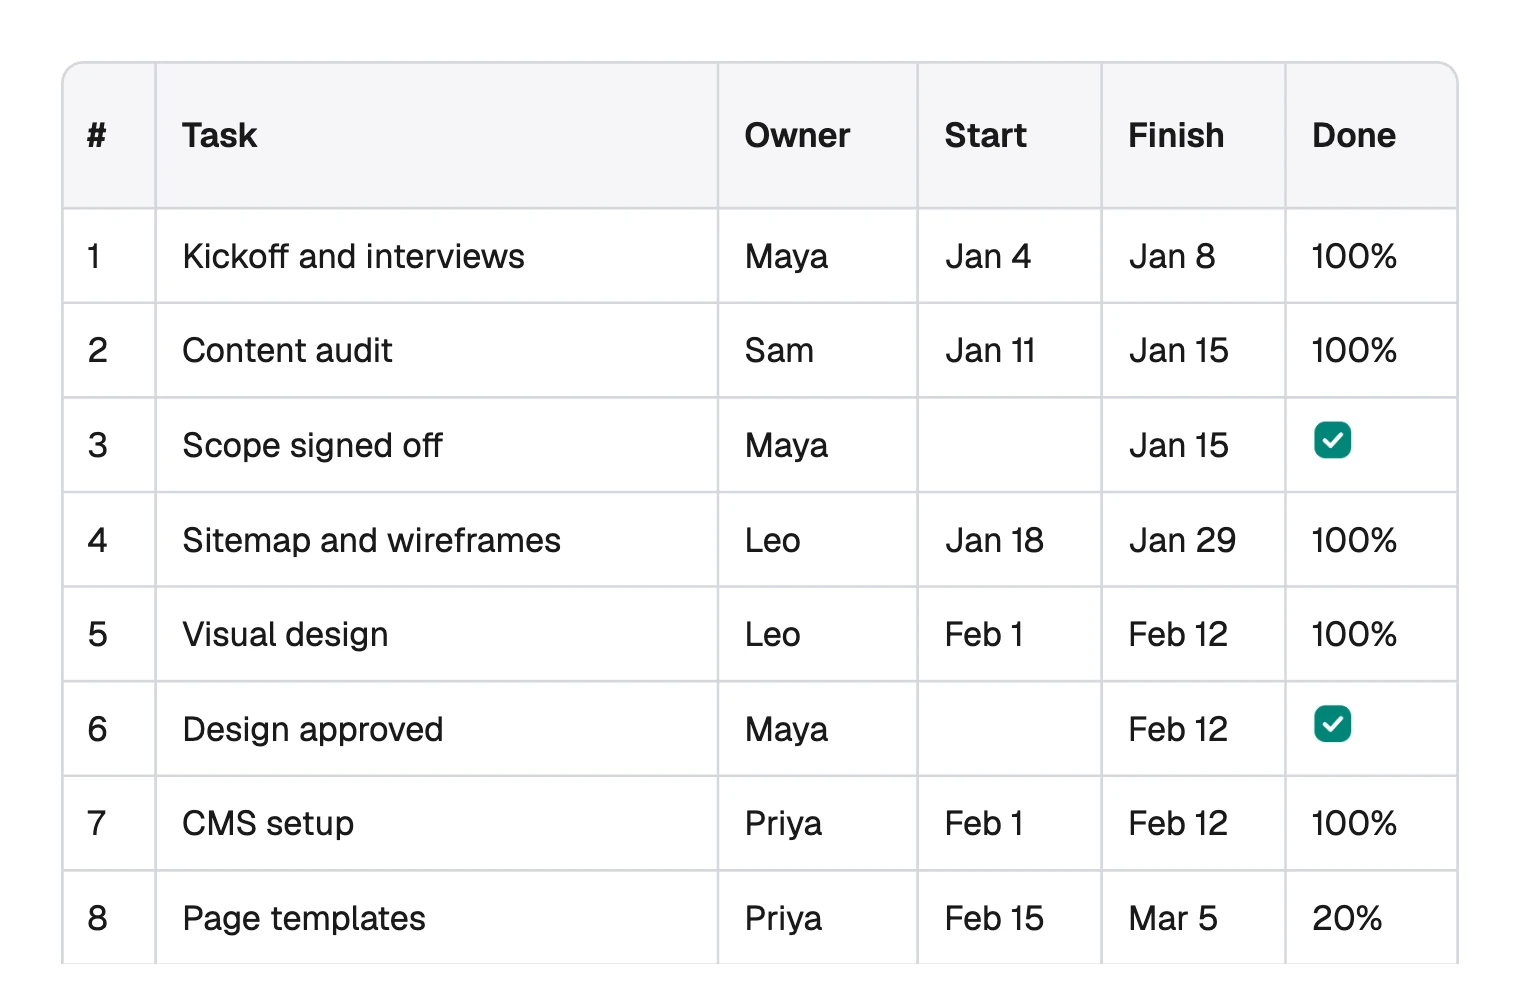
Add milestones as rows of their own. “Scope signed off” and “Design approved” take no time, but work waits for them.
Set dates and owners
Give each task one owner and let that person set the length. “Content writing” runs Feb 1 to Feb 26 because Sam said so, not because the chart had room. Leave the start date empty on a milestone.
Link dependencies
Ask of each task: what must be finished before this can begin? Draw that as an arrow. Most links run from the end of one task to the start of the next.
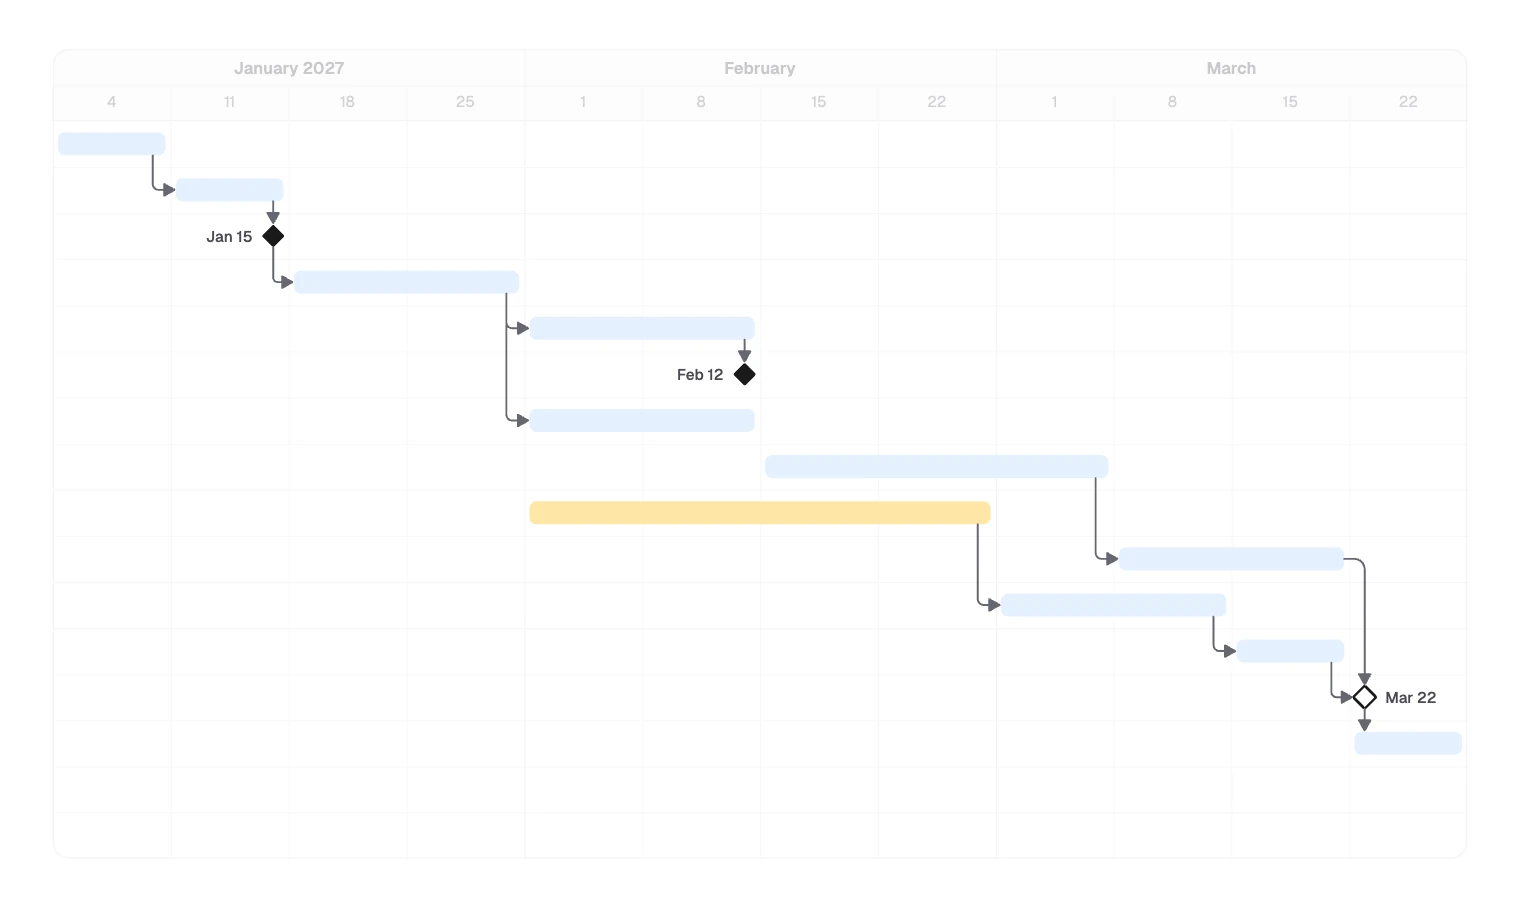
In the example, “Page templates” waits for both “Design approved” and “CMS setup”. If either slips, so do “QA and accessibility” and “Go live”.
Track progress
Once a week, update the done column, grow the darker part of each bar and move the today line. Then read down the line.
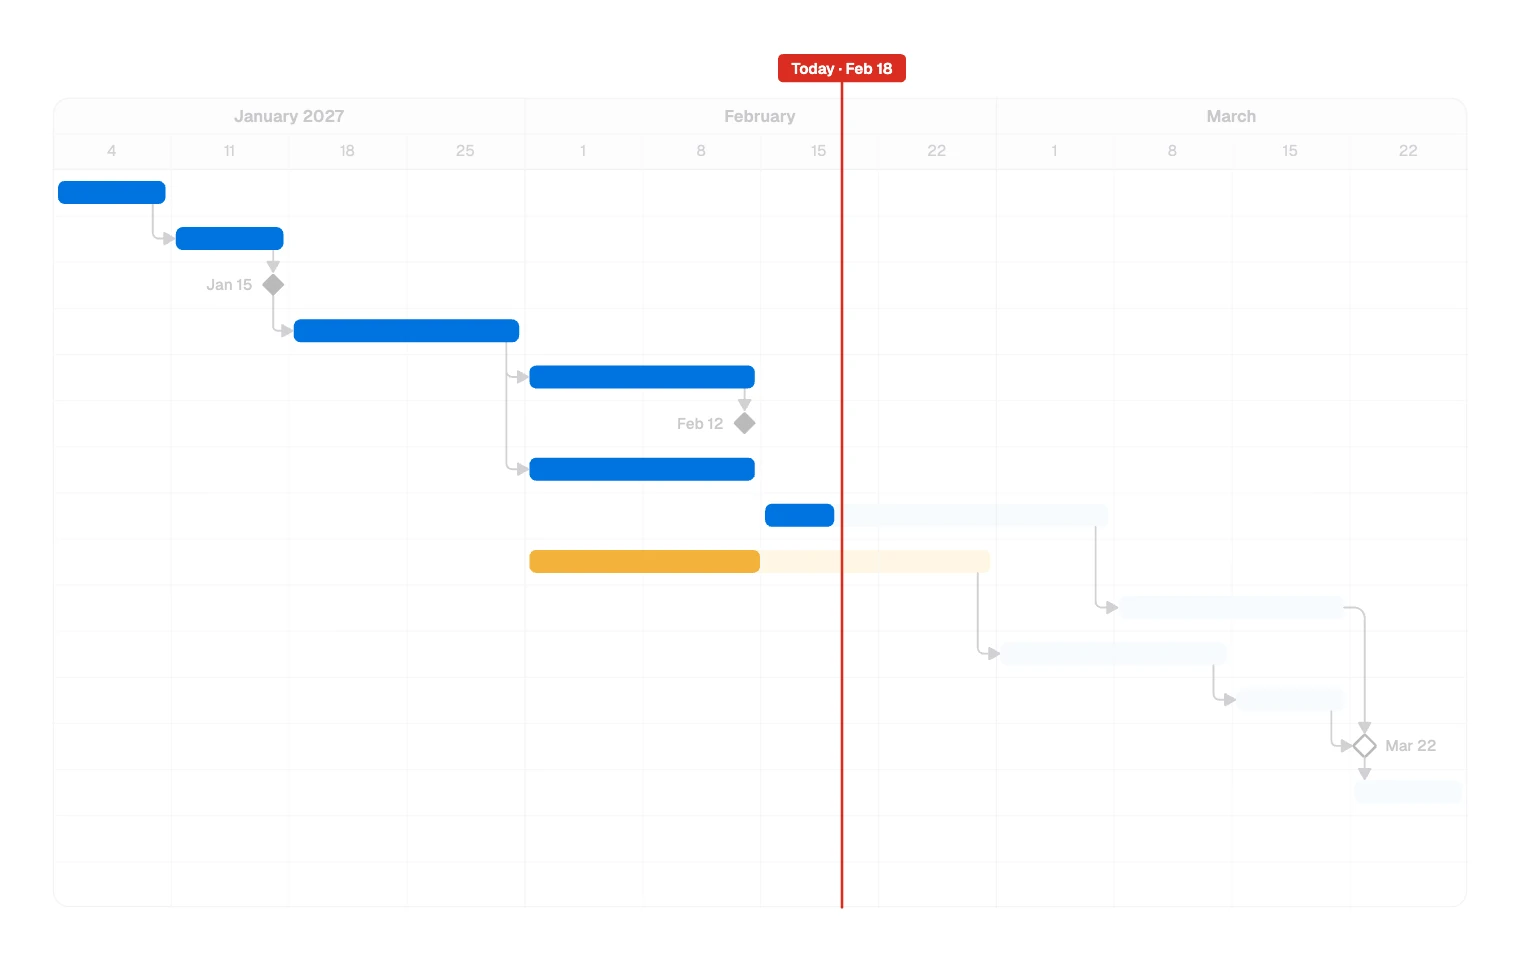
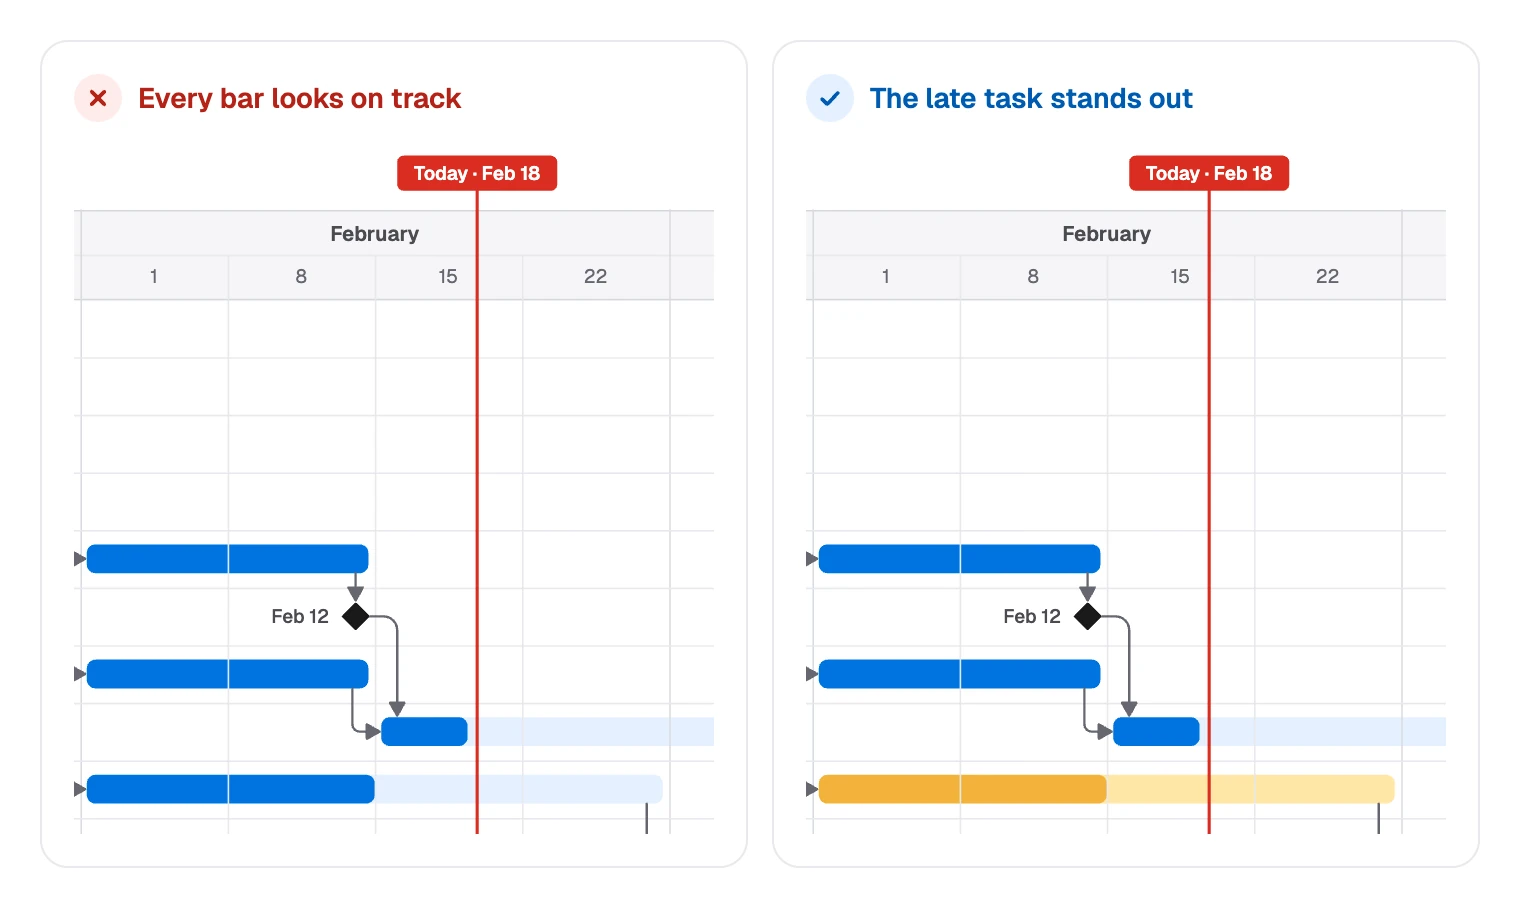
On Feb 18, “Content writing” is at 50% with about 70% of its working days gone. It feeds “Content migration”, then “Redirects and SEO”, then “Go live”. Making it stand out starts the right conversation:
Drawing a Gantt chart in FlowDraw
The template is free on every plan. It uses 128 of the 150 elements a Free board can hold, and a new task costs three: a bar, a done bar and an arrow.
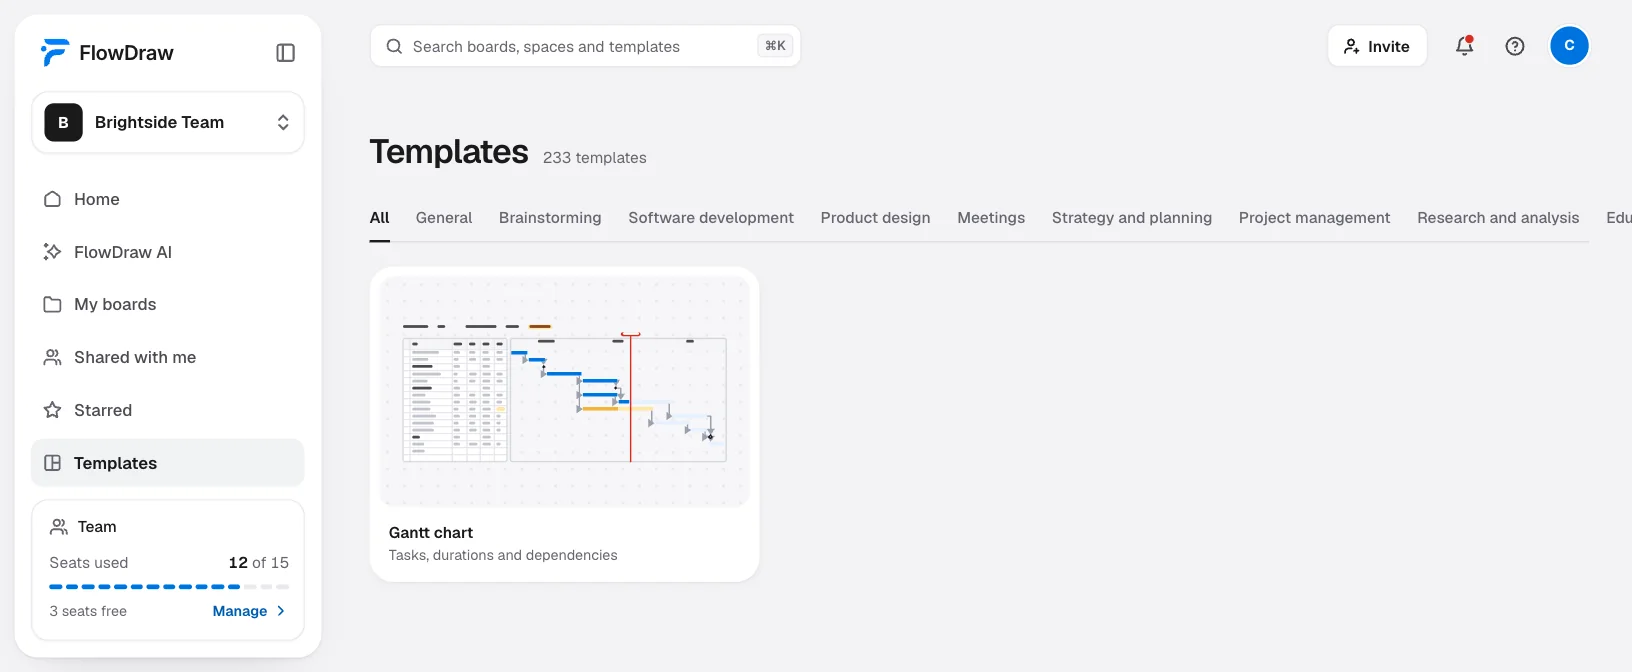
Open the template
Search for “Gantt chart” under “Templates”, open the card, then choose “Use template”.
Fill in the table
Double-click a cell and type. Two rows are spare. “Rows and columns” adds more, at the end only, and the grid beside it does not grow with them.
Place a bar
Zoom in, since bars are thin. Click a bar, press ⌘D (Ctrl+D on Windows) and drag the copy to its row. A corner handle sets its length.
Draw the arrows
Press Esc, then L, and drag from one bar to the next. The arrow stays attached to both bars.
Show progress
The done part is a darker bar. Click it, drag a corner handle, then retype the “Done” cell.
Move the today line
Delete the red line and drag the label along. Press Esc, then L, and draw from the label to just below the chart. In “Line properties”, choose “Straight”, end “None” and red.
Share it
Choose “Share” and add people. On Free everyone invited can edit, and on Pro only one person can. The “Embed” tab gives a read-only copy with no account.
Three limits to plan around:
- Nothing is linked. Bars are shapes and the table is text, so moving a bar changes no date and nothing reschedules itself.
- Some marks sit under the table. Check marks and the amber pill are separate elements, and the table takes any click over them. Drag the table aside, change them, then drag it back.
- AI will not draw this. FlowDraw’s AI does not make Gantt charts. It draws a schedule as a plain table.
Gantt chart mistakes to avoid
- Too many rows. Over a few dozen tasks, nobody reads it. Roll small tasks up.
- No arrows. Without them, a slip looks like one person’s problem. With them, you see who is next.
- Dates without owners. A bar nobody owns will not move when it should.
- Milestones as long bars. A sign-off happens on a day. Draw the review as a task and the sign-off as a diamond.
- A chart drawn once. A Gantt chart that is three weeks old misleads people. Pick a day and update it.
- Equal length for everything. Identical bars usually mean someone guessed. Ask the owner.
FAQ
It plans and tracks a project with a fixed end date. It shows what happens when, who owns it, which tasks wait for others and whether the work is on schedule today.