
How to make a fishbone diagram
A fishbone diagram sorts the possible causes of one problem. Learn to pick categories, ask why, test what you find and draw one in FlowDraw.
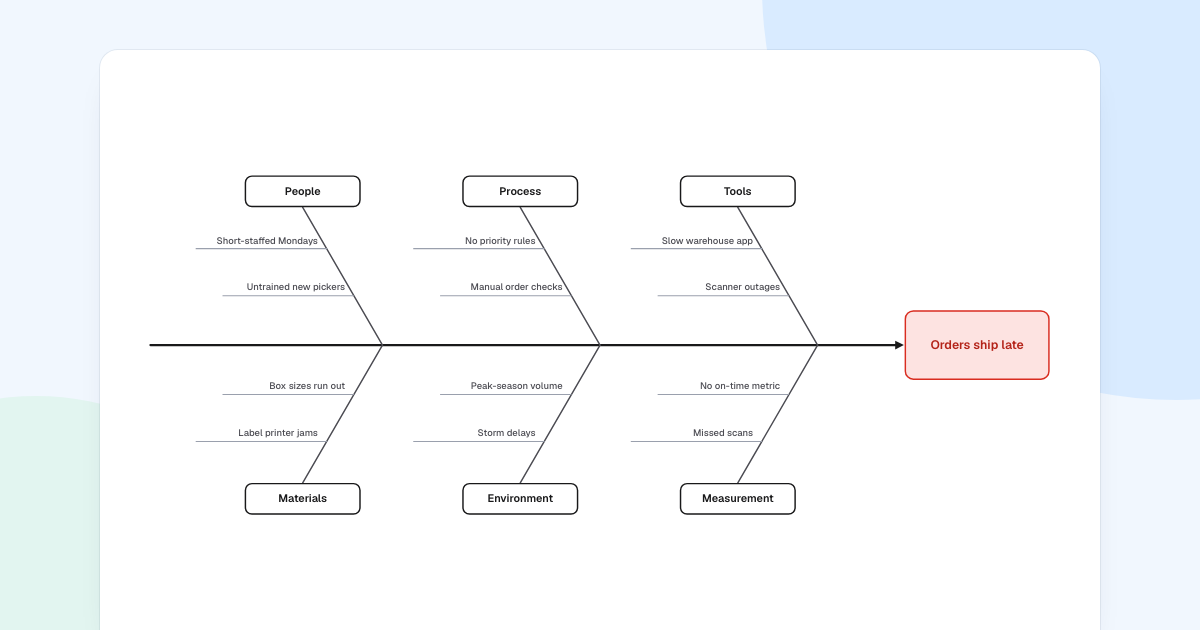
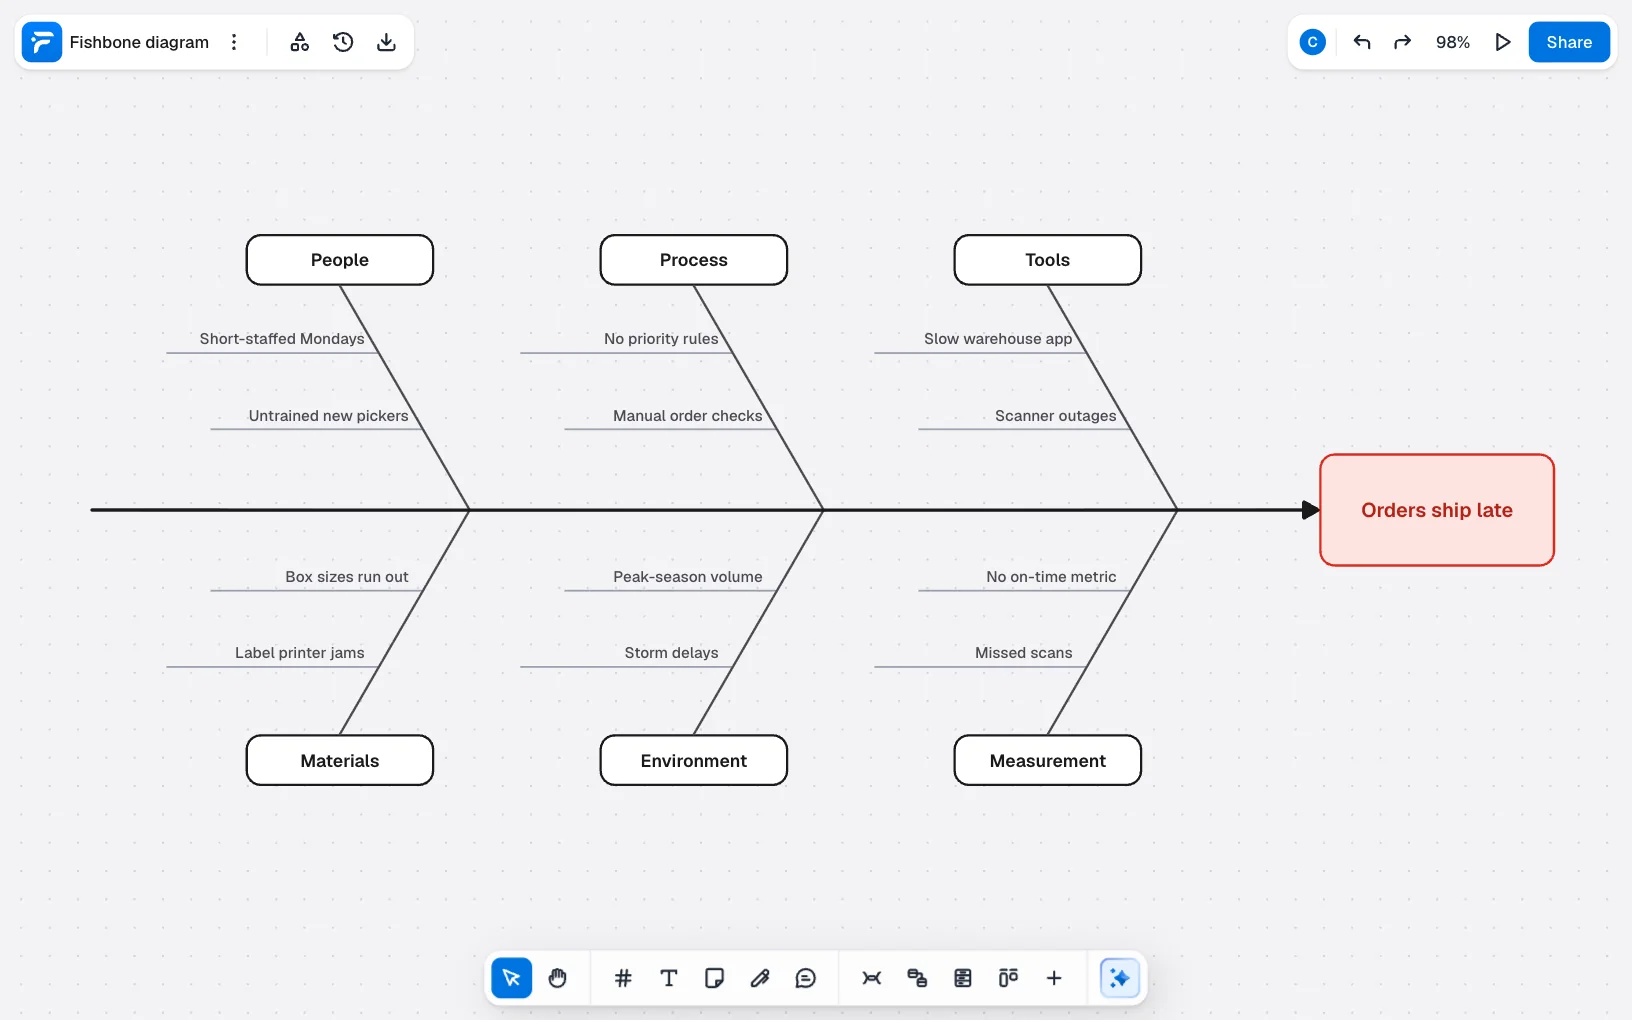
Orders ship late, and everyone has a theory. The warehouse blames the app, the app team blames training. A fishbone diagram puts every theory on one page, sorted, before anyone fixes the wrong thing. You can make one in about 30 minutes.
Quick AnswerA fishbone diagram sorts the possible causes of one problem. Write the problem at the head, draw a spine toward it, add one bone per category such as People or Process, list causes on each bone, and ask why until you reach something you can test.
What is a fishbone diagram?
It is a tool for groups: it collects what people suspect and shows where to look next. The name comes from its shape. The other common name, Ishikawa diagram, comes from Kaoru Ishikawa, the Japanese quality expert who made it popular.
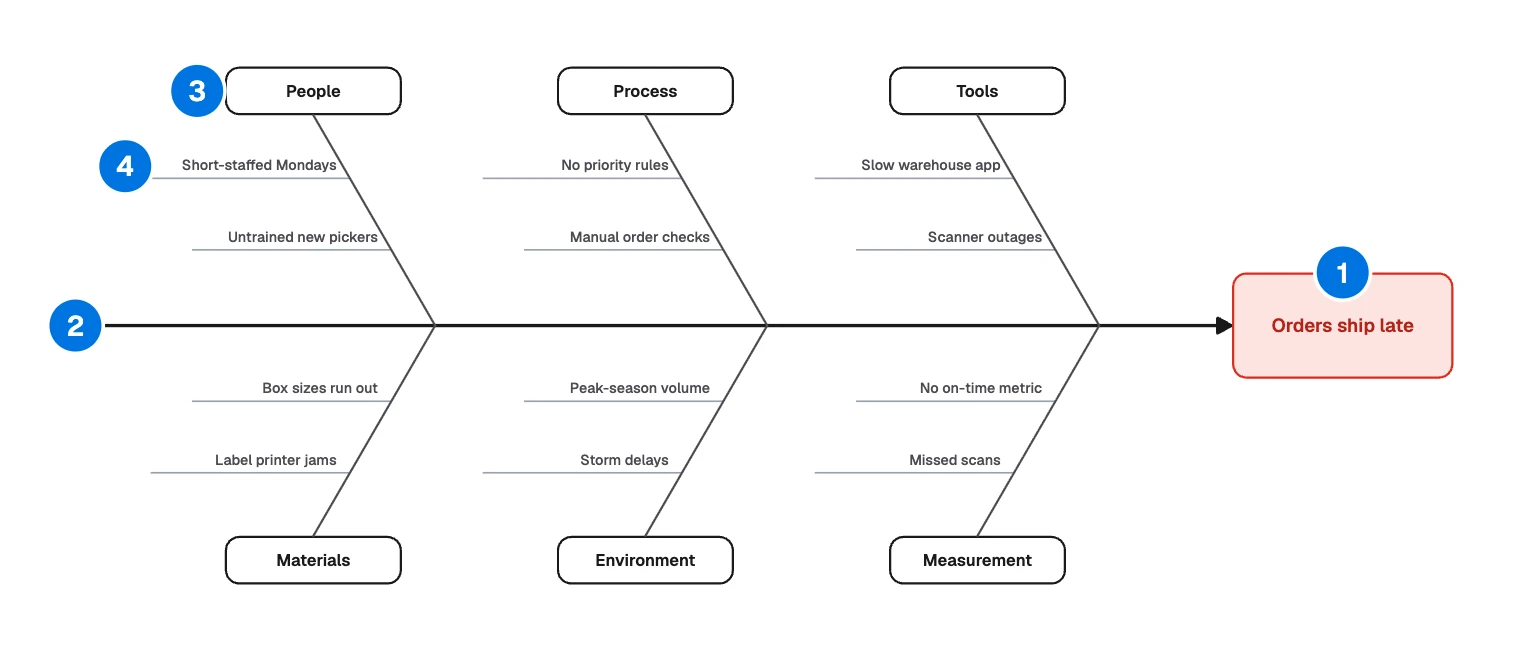
- Head: the problem, as one statement.
- Spine: the arrow leading to the head.
- Main bones: categories of cause, such as People or Process.
- Small bones: specific causes, such as “Short-staffed Mondays”.
Use one when a problem has many plausible causes and people disagree about them. If the causes form one clear chain, the “5 whys” template is quicker. If nobody can describe the process yet, draw it first as a flowchart.
How to make a fishbone diagram
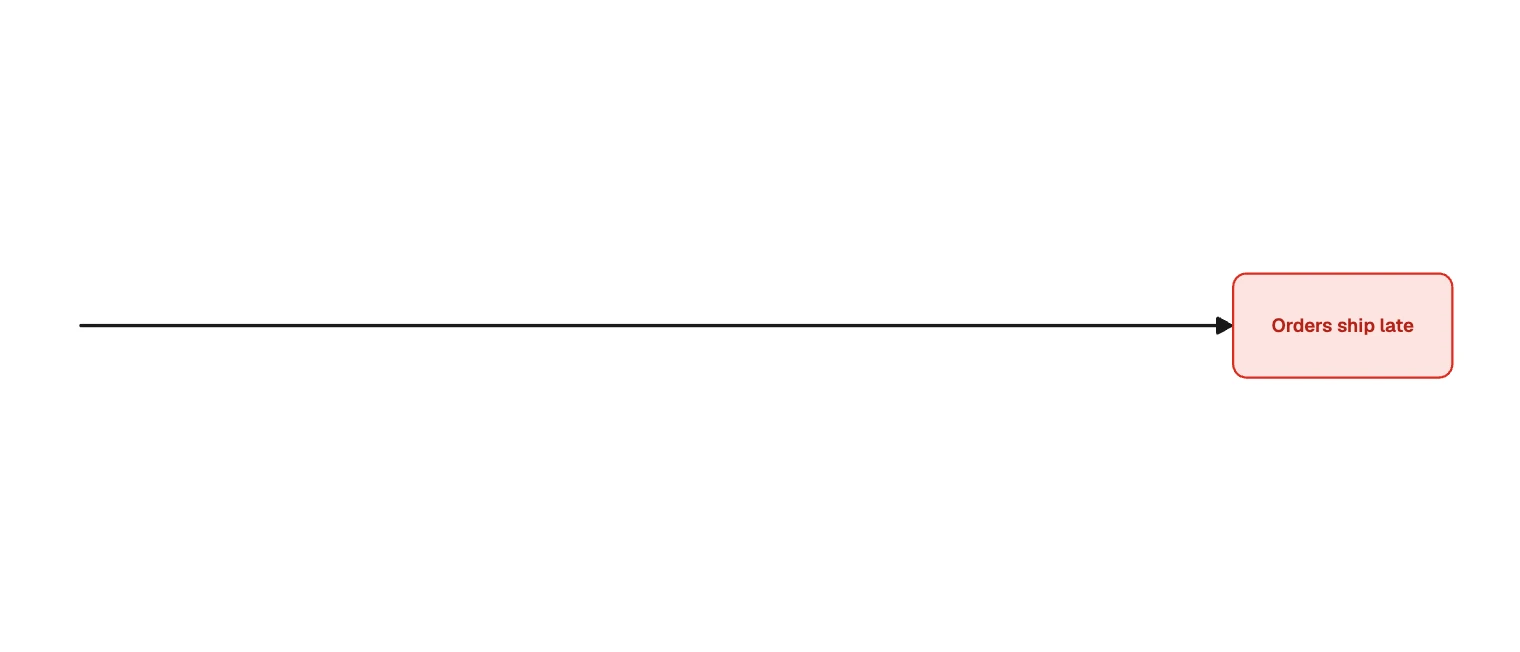
State the problem as a fact
Agree what “Orders ship late” means first: which orders, how late and since when. If people picture different problems, you collect causes for different problems.
Pick the bones
The example uses the classic 6 Ms from manufacturing, in plainer words. Four to six bones is usual, and a bone nobody can fill should go.
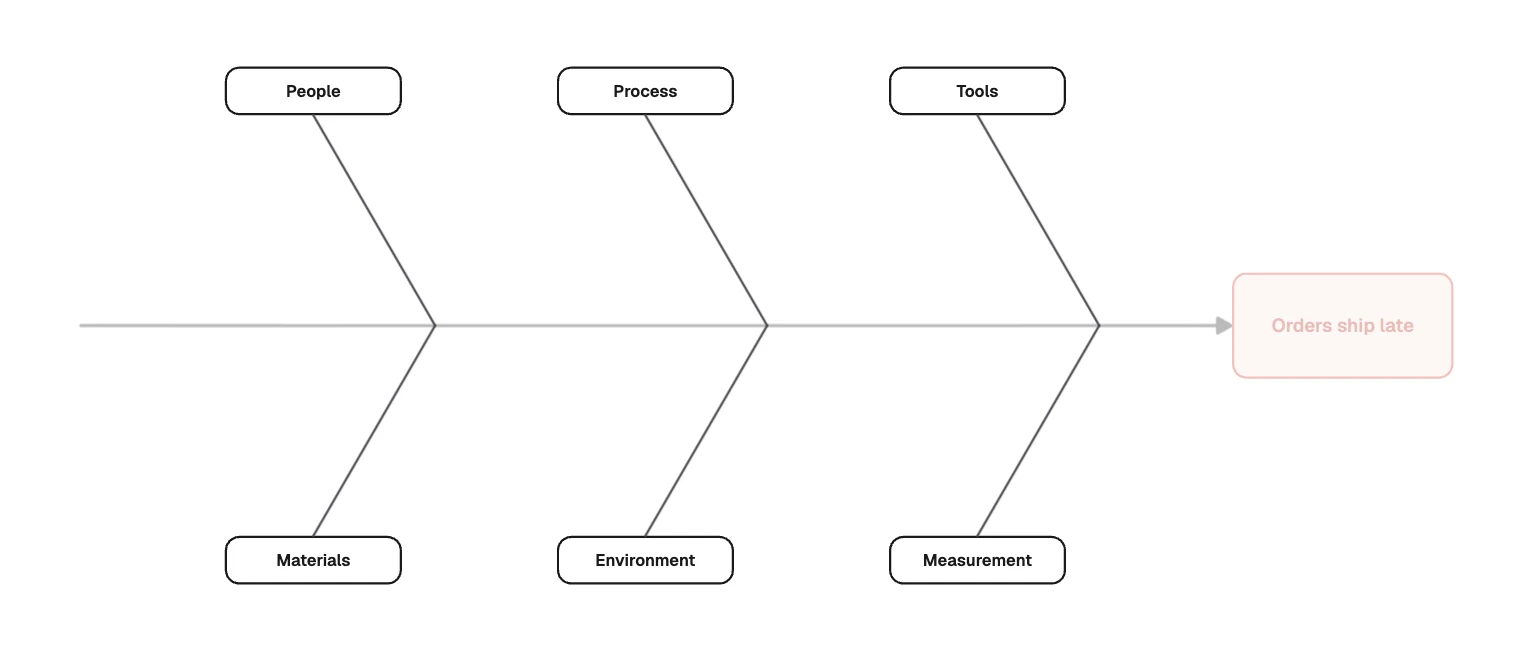
| In the example | Classic name | Question to ask |
|---|---|---|
| People | Man | Who does the work, and what do they know? |
| Process | Method | What procedure do they follow? |
| Tools | Machine | What equipment and software do they rely on? |
| Materials | Material | What goes into the work? |
| Environment | Mother Nature | What around the work affects it? |
| Measurement | Measurement | How do we know what is happening? |
These suit physical work. For service or software problems, rename them to fit.
Collect causes, quietly at first
Give everyone a few minutes to write causes alone, so the first loud theory does not set the direction. Then place each one on a bone.
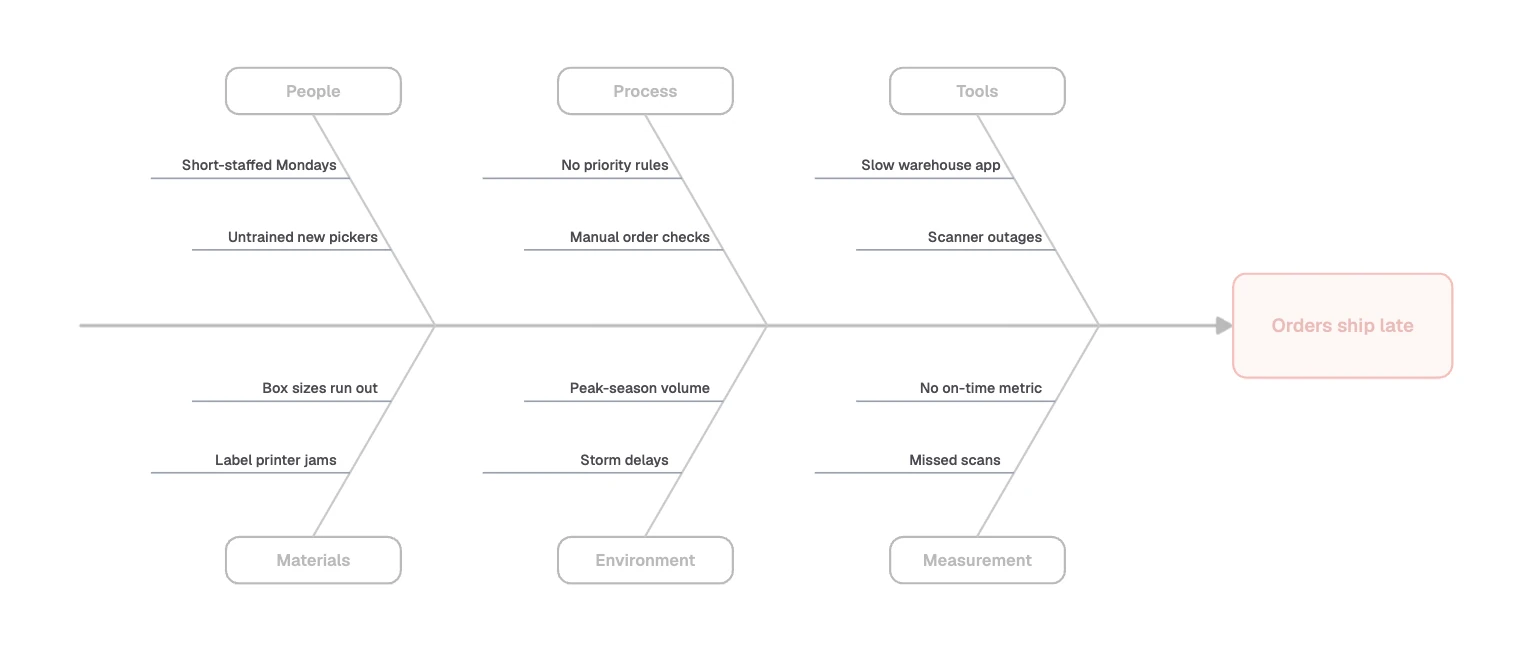
Write specific statements, so someone can go and check them:
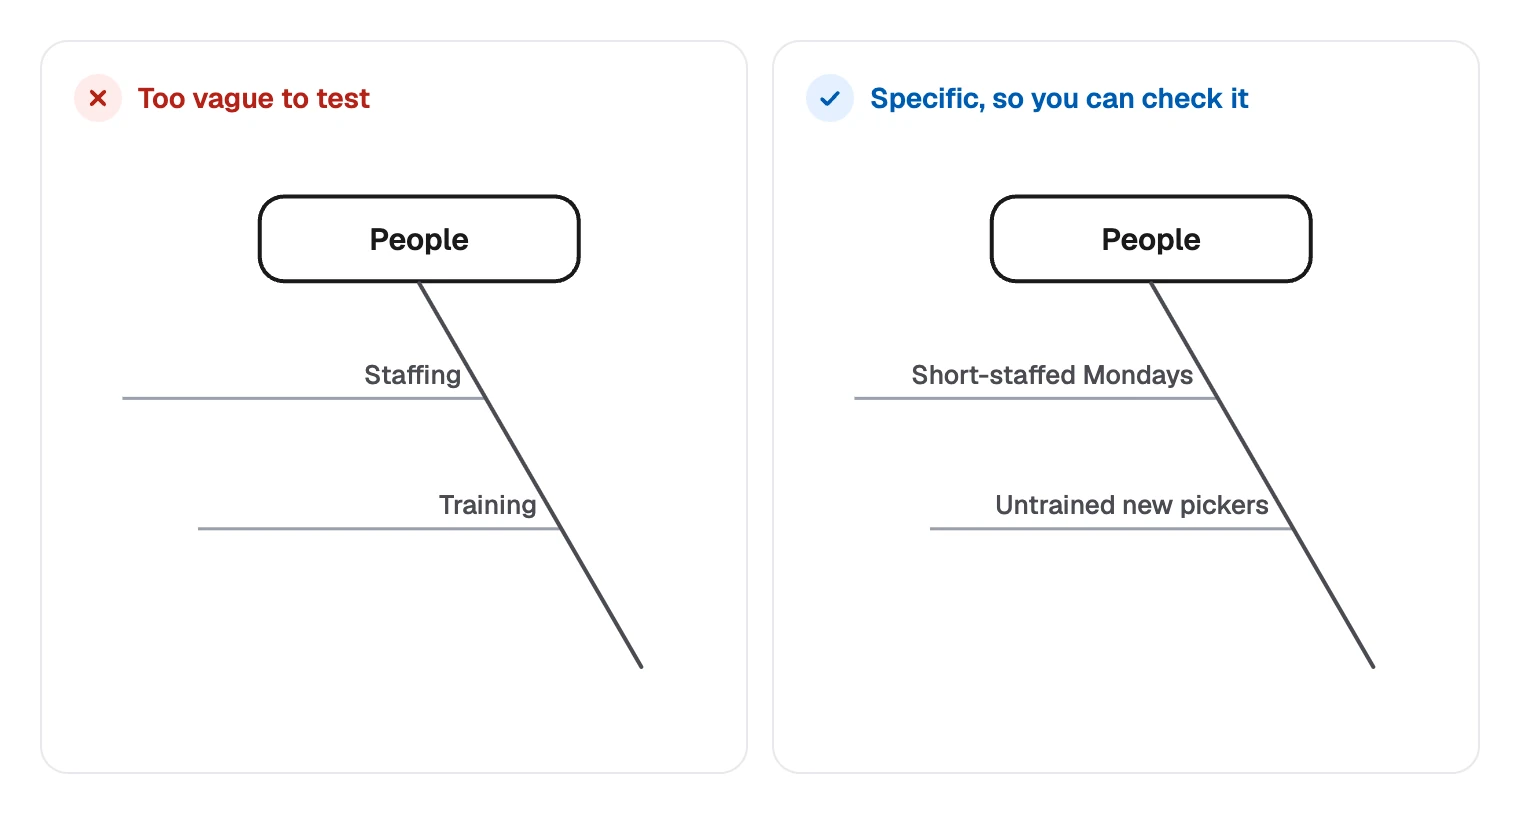
Ask why
For each cause, ask why it happens and add the answer as a smaller branch. Why are there untrained new pickers? Perhaps training stops during busy weeks. Keep going until you reach something you can act on or test.
Choose what to test
Agree on the few causes most likely to matter, then check them against data. Do late orders cluster on Mondays? Do they follow scanner outages? Here, “No on-time metric” and “Missed scans” come first, because without them you cannot test the rest.
Why the example is drawn this way
- The head sits on the right, so the eye follows the arrow from causes to effect.
- A real diagram is lopsided. A crowded bone shows where attention went, and an empty one may show what nobody has looked at.
- Causes outside your control still belong. “Storm delays” is one. You can plan around it, and writing it down stops it becoming a catch-all excuse.
Drawing a fishbone diagram in FlowDraw
The template is free on every plan, and nothing in this diagram needs Pro.
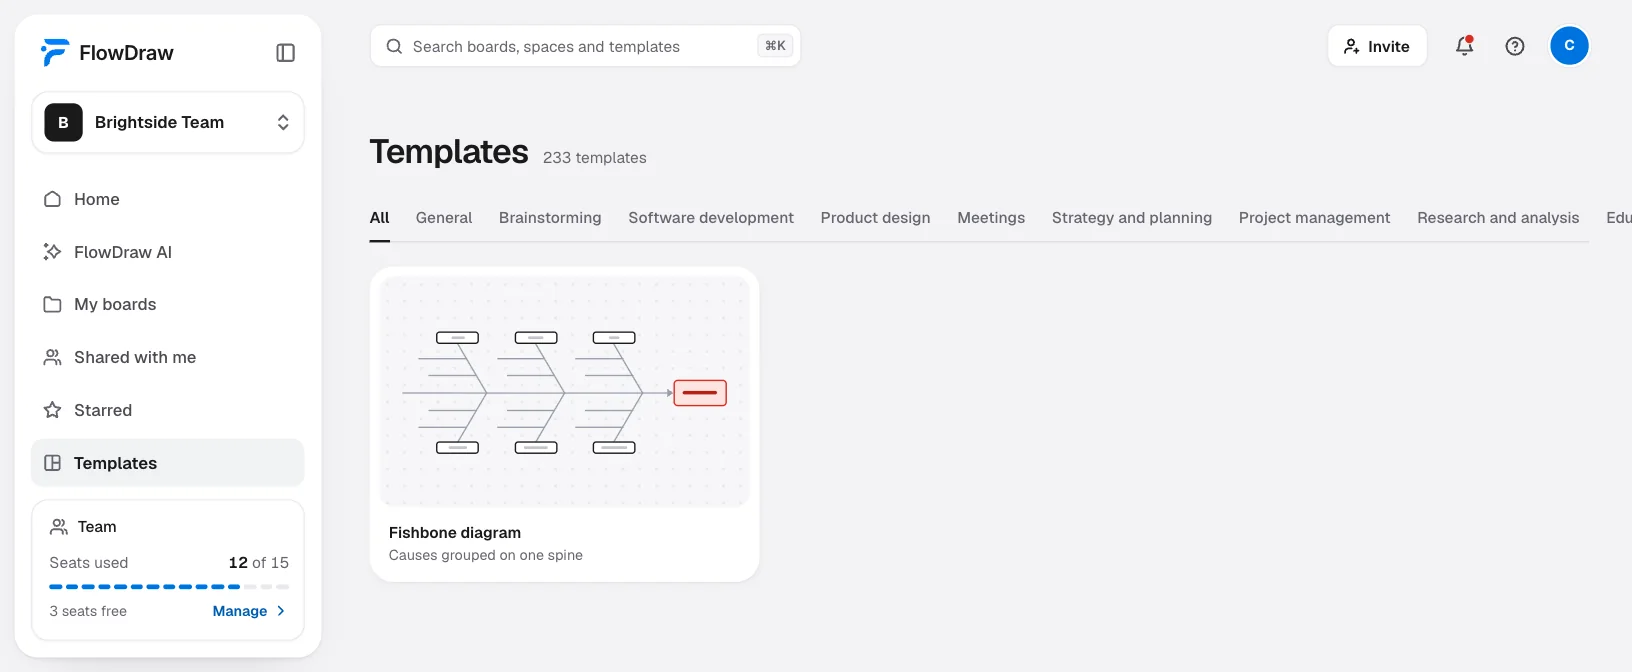
Open the template
Search for “Fishbone diagram” under “Templates”, open the card, then choose “Use template”.
Write your problem and bones
Double-click the box at the head and type your problem. Do the same for each category box.
Add a cause
Each cause is a text box on a thin line. Shift-click both, press ⌘D (Ctrl+D on Windows) and drag the copy into place. A dashed guide appears when it lines up.
Add a bone
Copy a category box, press Esc, then L, and draw a line from the spine to the box. In “Line properties”, choose “Straight” and set the end to “None”. FlowDraw cannot rotate shapes, so slanted bones are always connectors.
Work on it together
Choose “Share” and add people. They can add causes alongside you, and you see their cursors. On Free, everyone you invite can edit. On Pro only one person can, so others press C and comment.
Mark what to test
FlowDraw has no voting or timers. Agree aloud and change the text with “Color” in “Text properties”, or each person presses Esc, then N, and drops a note beside their picks.
On a blank board, press L to draw the spine, R for the boxes and T for each cause, with Esc between them. “5 whys”, “Problem tree” and “Cause and effect” are free templates too.
Fishbone diagram mistakes to avoid
- A vague head. “Quality is poor” invites everything. Name one problem you could measure.
- Solutions dressed as causes. “Need a new scanner” is a fix. Write the fault: “Scanner outages”.
- Stopping at labels. “Training” cannot be tested. Ask why again.
- Filling every bone evenly. Identical counts usually mean people are padding.
- Treating the picture as the answer. The favourite cause is still a guess until the data agrees.
- Several problems in one head. “Orders ship late and arrive damaged” needs two diagrams.
FAQ
It helps a group list and sort the possible causes of one specific problem, so they can decide what to investigate. It gives you ideas to test, not proof of the cause.