
How to make a Venn diagram
How to make a Venn diagram: when overlapping circles help, how to sort items into regions, and how to build a two or three circle diagram in FlowDraw.
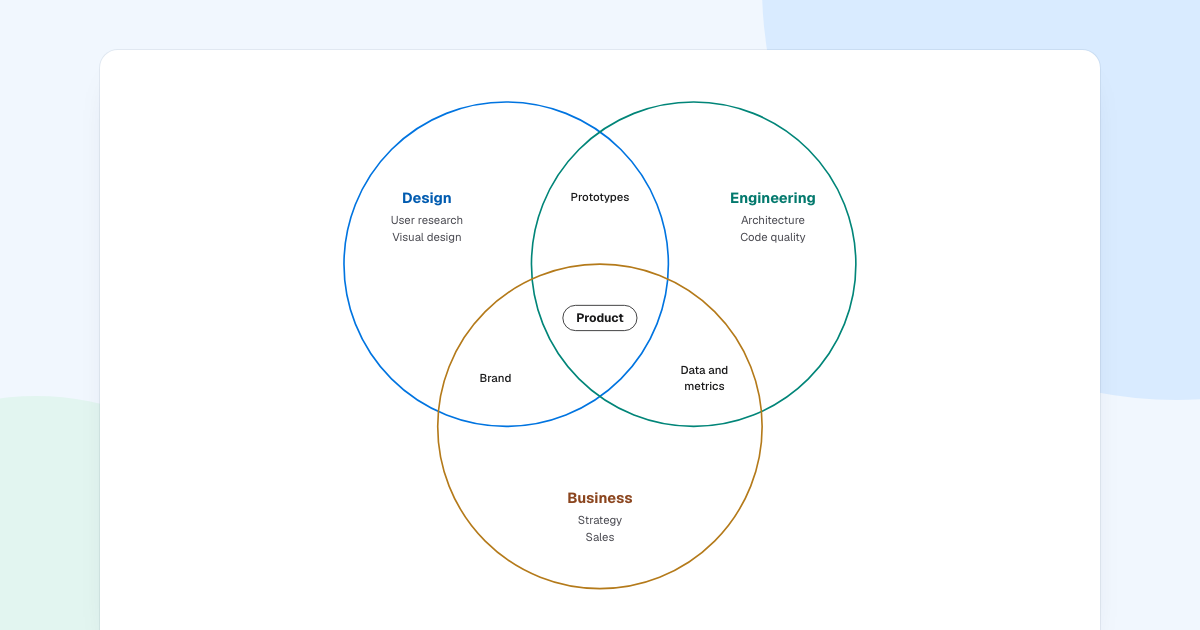
Who owns prototypes, Design or Engineering? Both. When the honest answer is “some of each”, a Venn diagram shows it better than a list does. Here is how to make a Venn diagram people can read, with a three-circle example from a product team.
Quick AnswerA Venn diagram uses overlapping circles to show what groups have in common. Each circle is a set, and each overlap holds what belongs to both. To make one, choose two or three sets, sort every item into its region, draw the circles and label the regions.
What does a Venn diagram show?
John Venn introduced these diagrams in 1880 as a way to picture logic. An item’s position is the whole message: it says which sets the item belongs to.
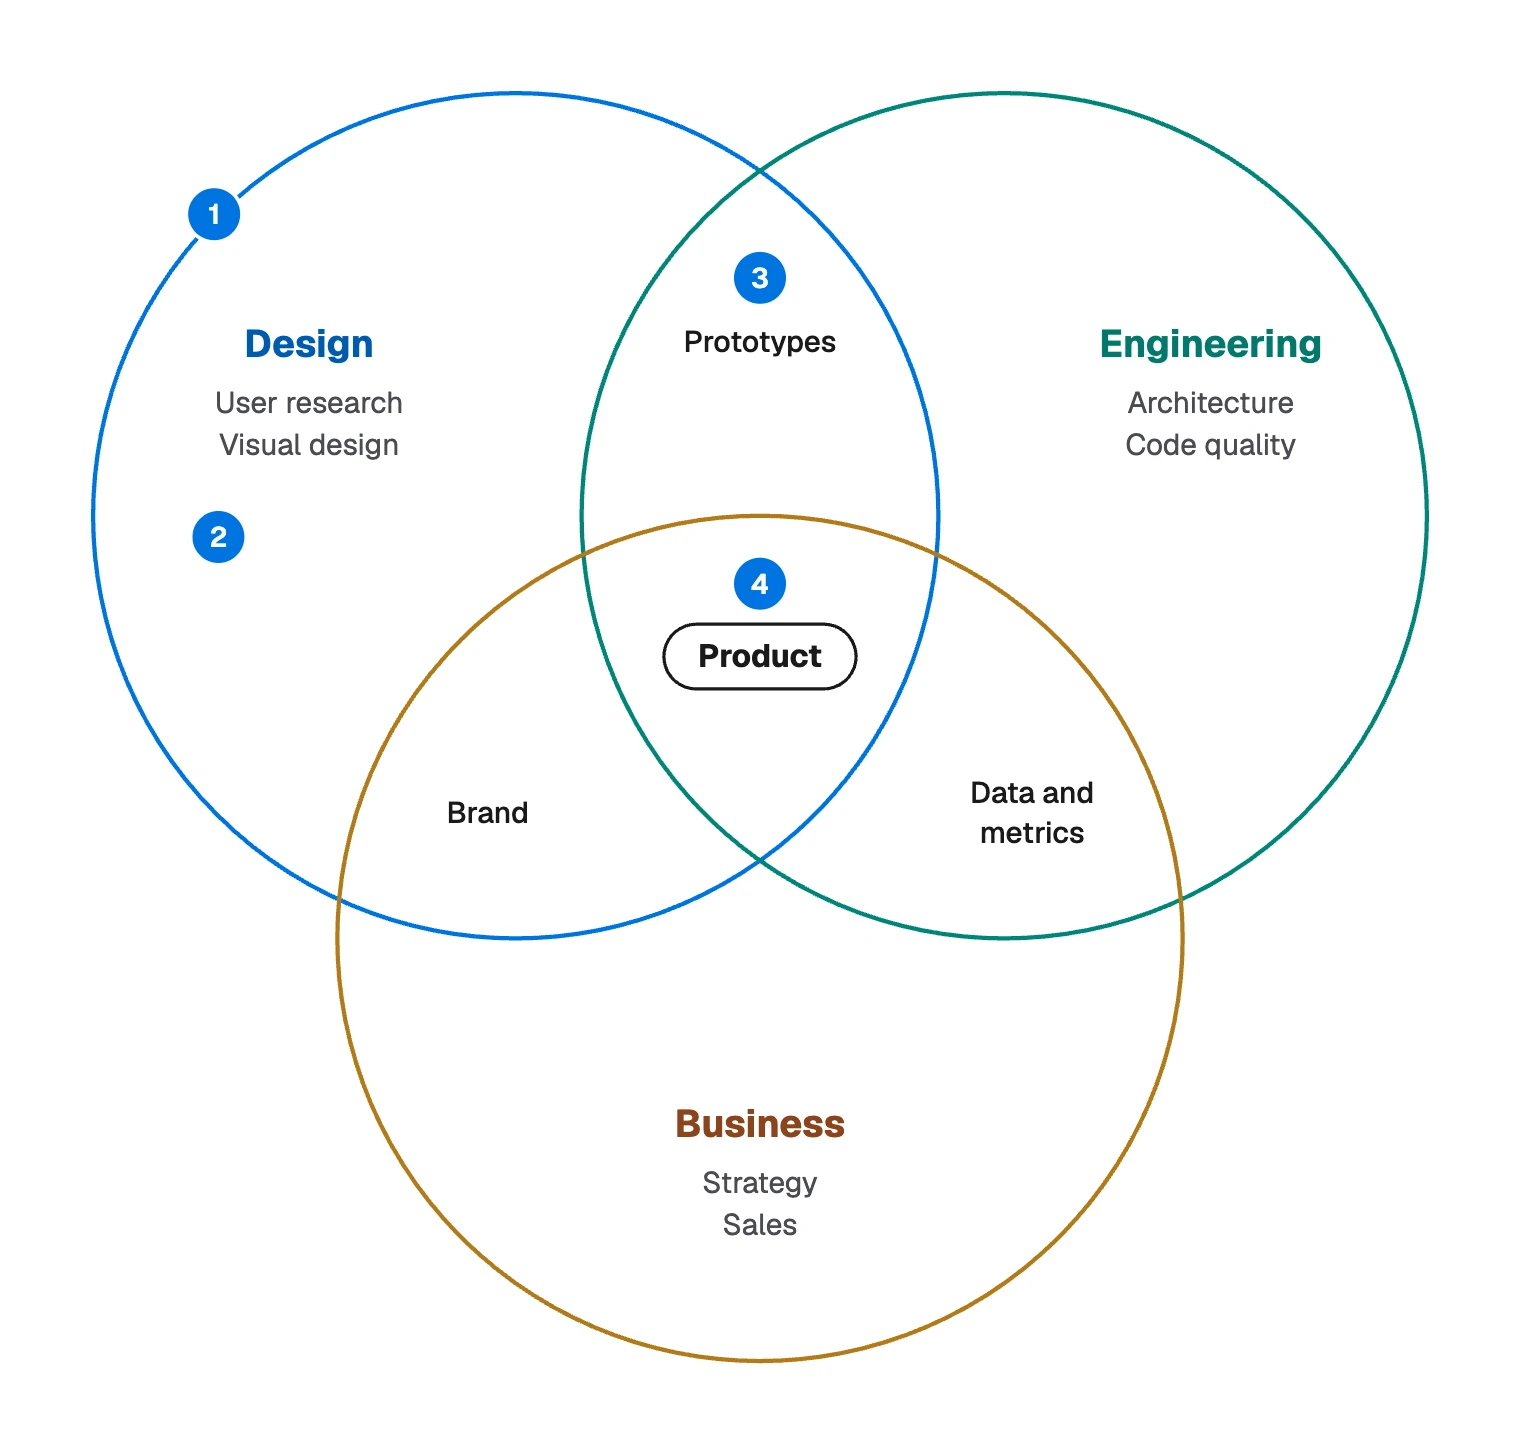
- Set: one circle, such as Design.
- Region for one set: what only that set holds, such as User research.
- Overlap: what two sets share, such as Prototypes.
- Center: what all the sets share, here Product.
Size, distance and left or right carry no meaning unless you say they do.
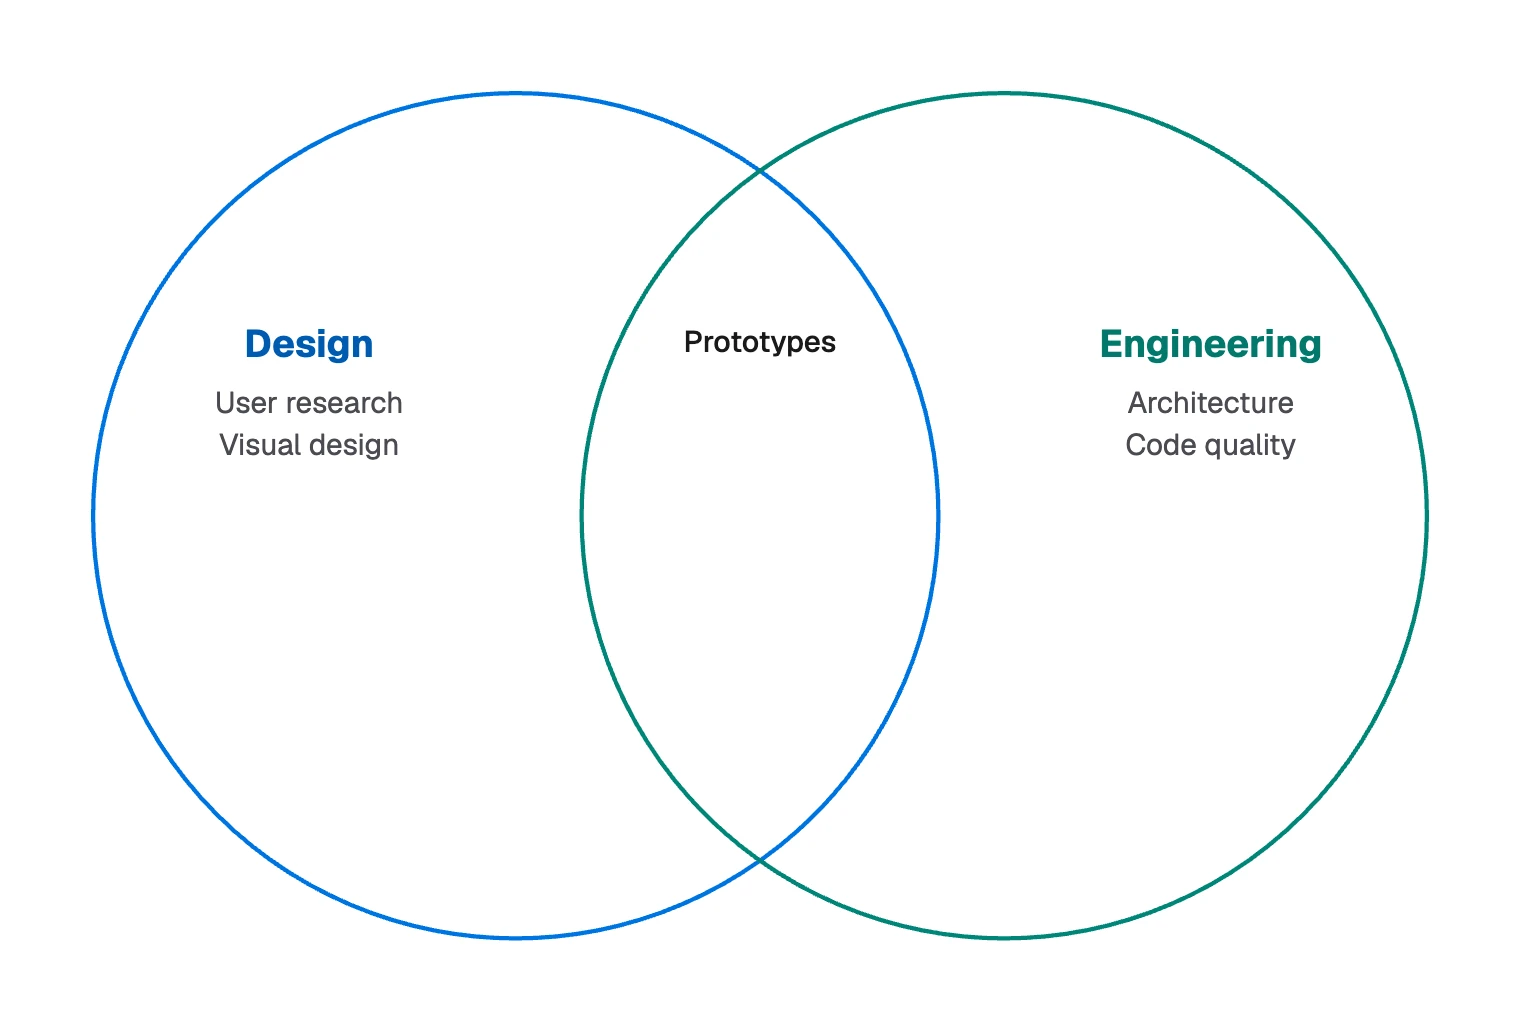
The number of regions grows quickly. Two circles make 3 regions and three circles make 7. Four sets make 15, and circles cannot draw them all, so four-set diagrams use ellipses. Most people should stop at three.
Who owns what: a worked example
FlowDraw’s “Venn diagram” template uses this as its sample, and every region in it makes a claim:
| Region | Items in the example | What it claims |
|---|---|---|
| Design only | User research, Visual design | Design leads this alone |
| Engineering only | Architecture, Code quality | Engineering leads this alone |
| Business only | Strategy, Sales | Business leads this alone |
| Design and Engineering | Prototypes | These two share it |
| Design and Business | Brand | These two share it |
| Engineering and Business | Data and metrics | These two share it |
| All three | Product | It needs everyone |
Read as seven claims, the diagram starts a useful conversation. Show it to a product team and someone will object: should Design really stay out of metrics? That argument is what you drew it for.
Product sits in its own pill because it is the conclusion. Be careful with overlaps, though: shared often turns into nobody’s job, so write a name beside each one.
When a Venn diagram fits, and when it does not
It fits when the question is what is shared and what is unique, across two or three groups whose members you can sort cleanly: skills across roles, features across products, customers across segments.
Other jobs have better tools:
| Your job | Better tool |
|---|---|
| Comparing options across many attributes | A grid, such as the “Comparison table” template |
| Showing how big something is | A chart, since these equal circles hold no data in their size |
| Showing how ideas relate | A concept map, which names the link |
| Showing who reports to whom | An org chart |
One close relative: an Euler diagram draws only overlaps that exist, so “all dogs are mammals” becomes one circle inside another. If some overlaps are impossible, Euler is the honest choice.
How to make a Venn diagram
- Ask one question. “What do these teams share?” Use it as the board’s name, as the picture at the top of this page does with “Who owns what”.
- Define each set so membership is a yes or no. If you keep arguing about whether something belongs, tighten the definition.
- Sort in a table first. Give each item a row and each set a column, then tick what applies. The ticks tell you the region.
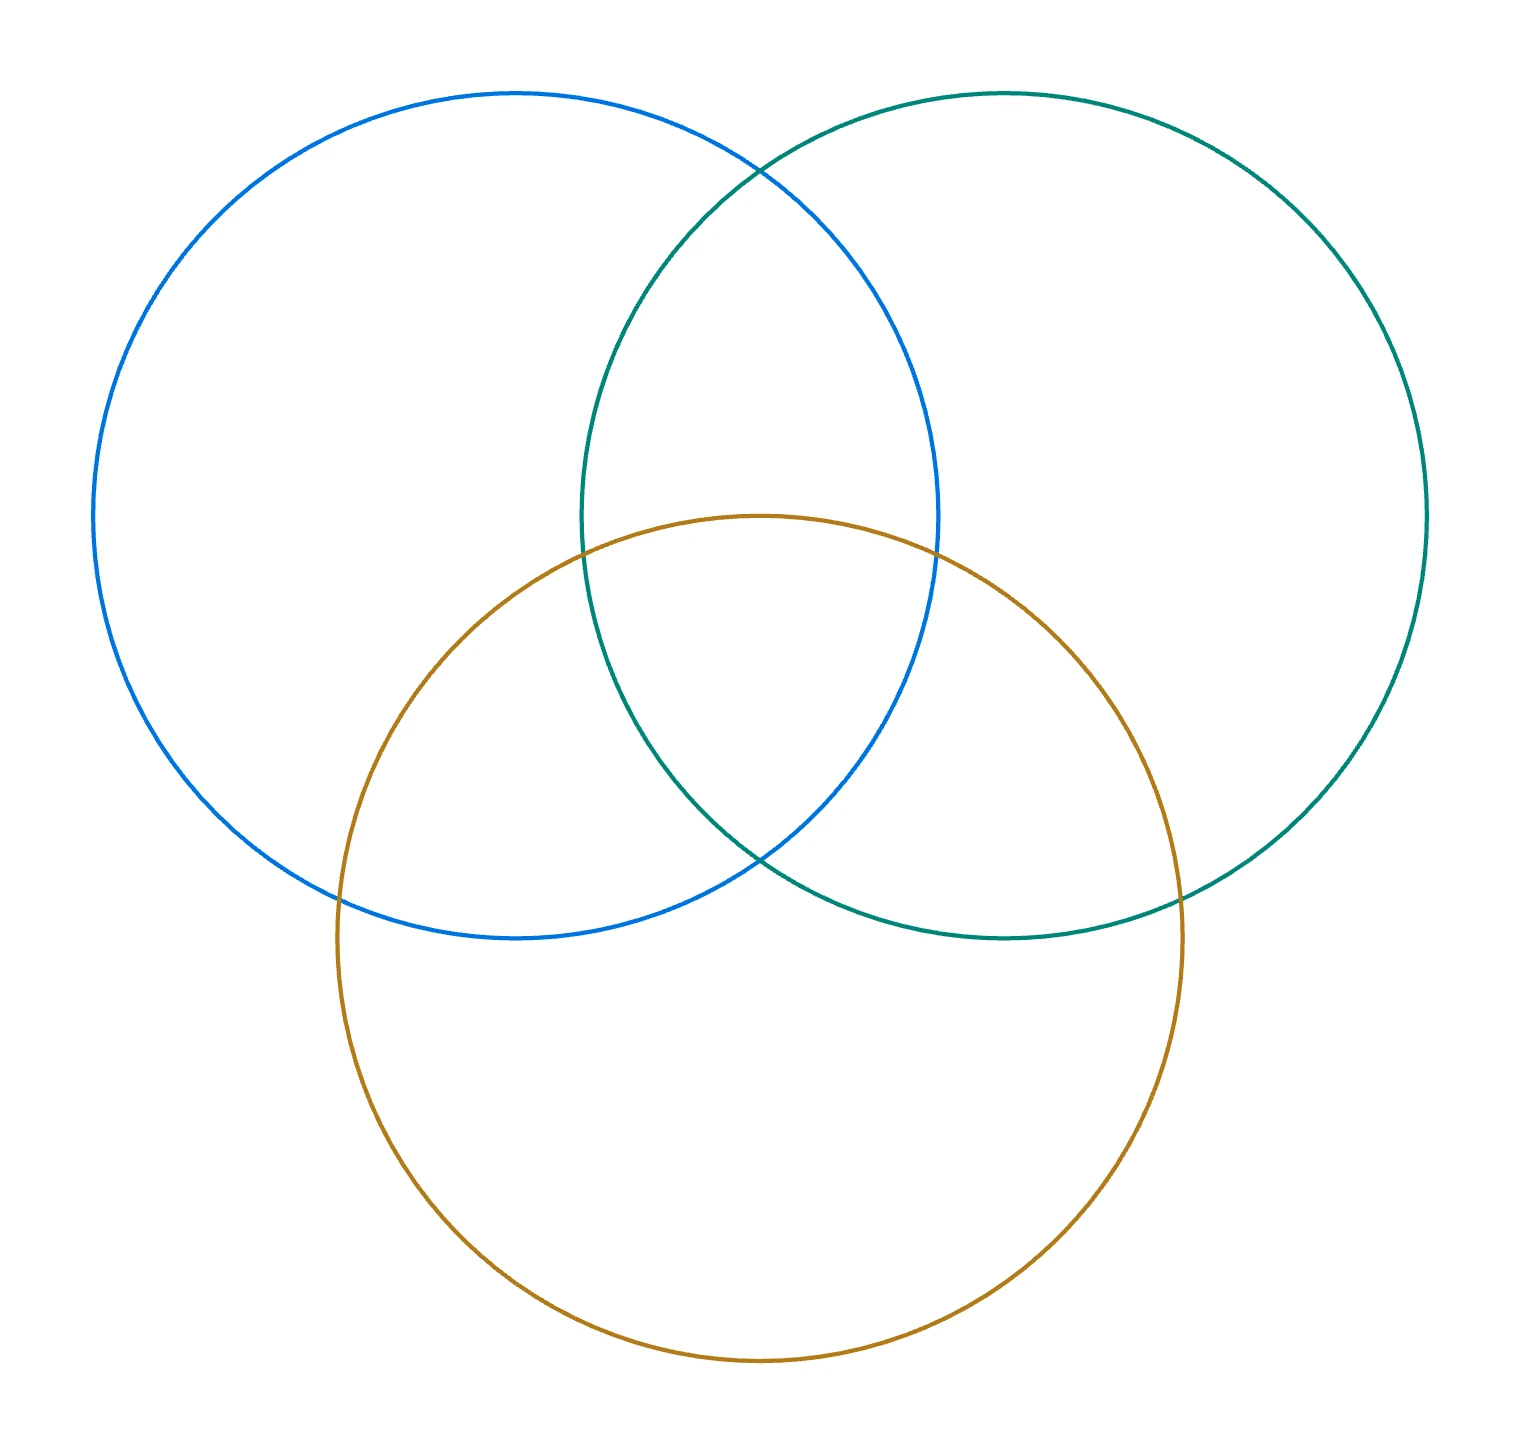
- Draw equal circles. Unequal sizes read as “bigger”, so keep them equal unless size means something. Leave enough overlap for text. In the template, circles 400 wide sit with their centers 230 apart.
- Place the labels. Put set names away from the overlaps and keep item names short. If a region needs a long list, number the items and add a key.
- Leave empty regions empty. “Nothing shared here” is a finding, so do not fill a gap for the sake of balance.
How to make a Venn diagram in FlowDraw
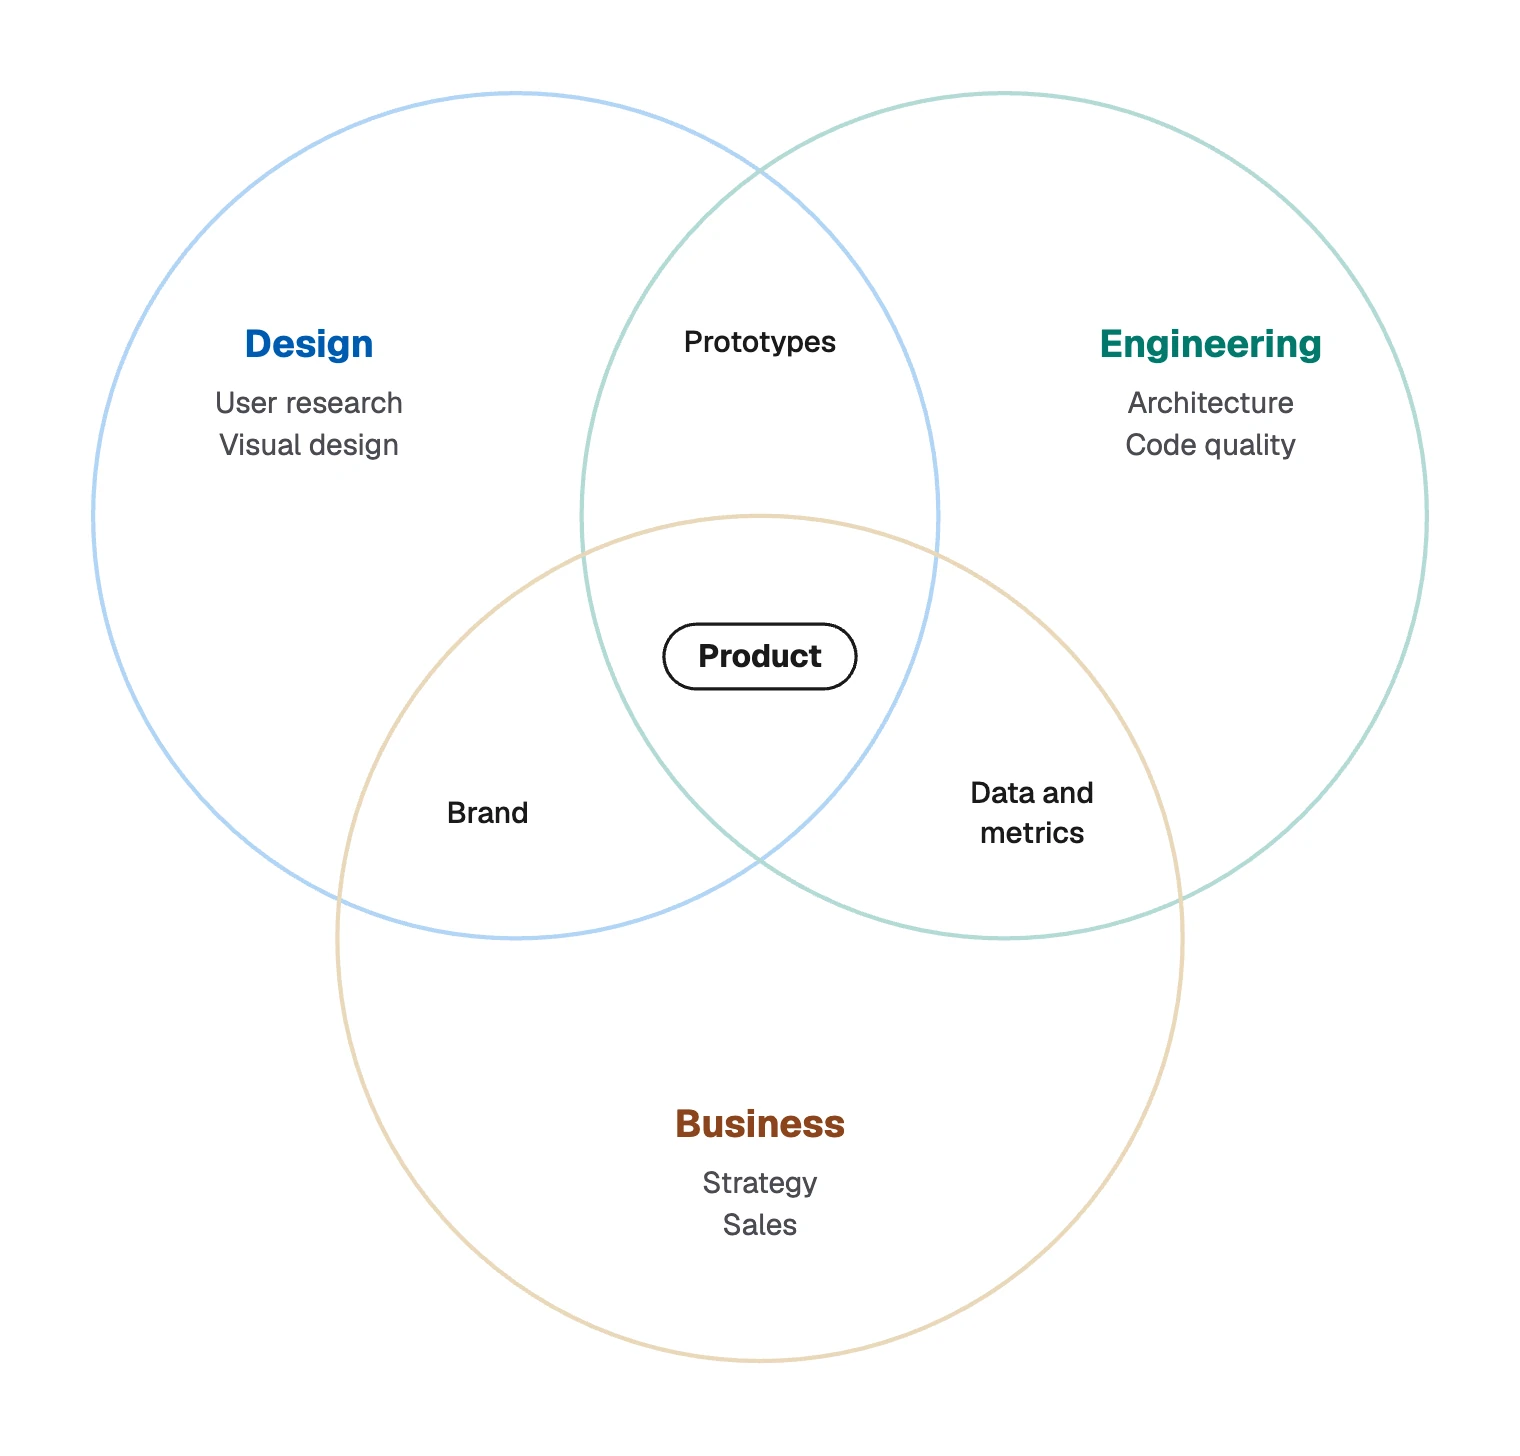
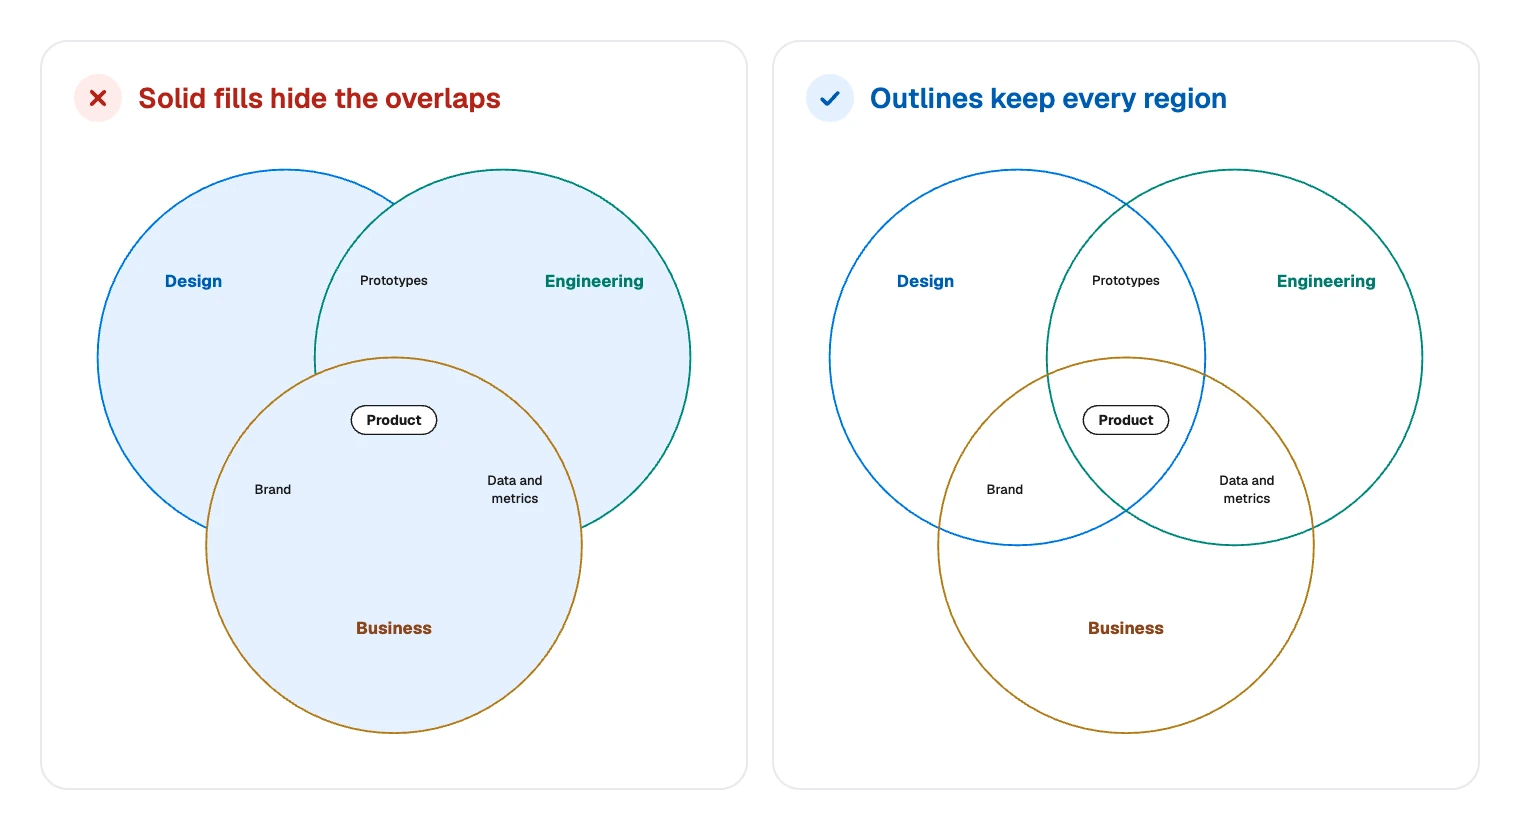
Start from the template, even for a simple diagram. Its preview shows a light tint, but on your board the circles are outlines with no fill.
That matters, because fills in FlowDraw are solid and have no opacity setting. A “Circle” from “Basic shapes” comes with a white fill, and the “Fill” swatches have no empty option.
Open the template
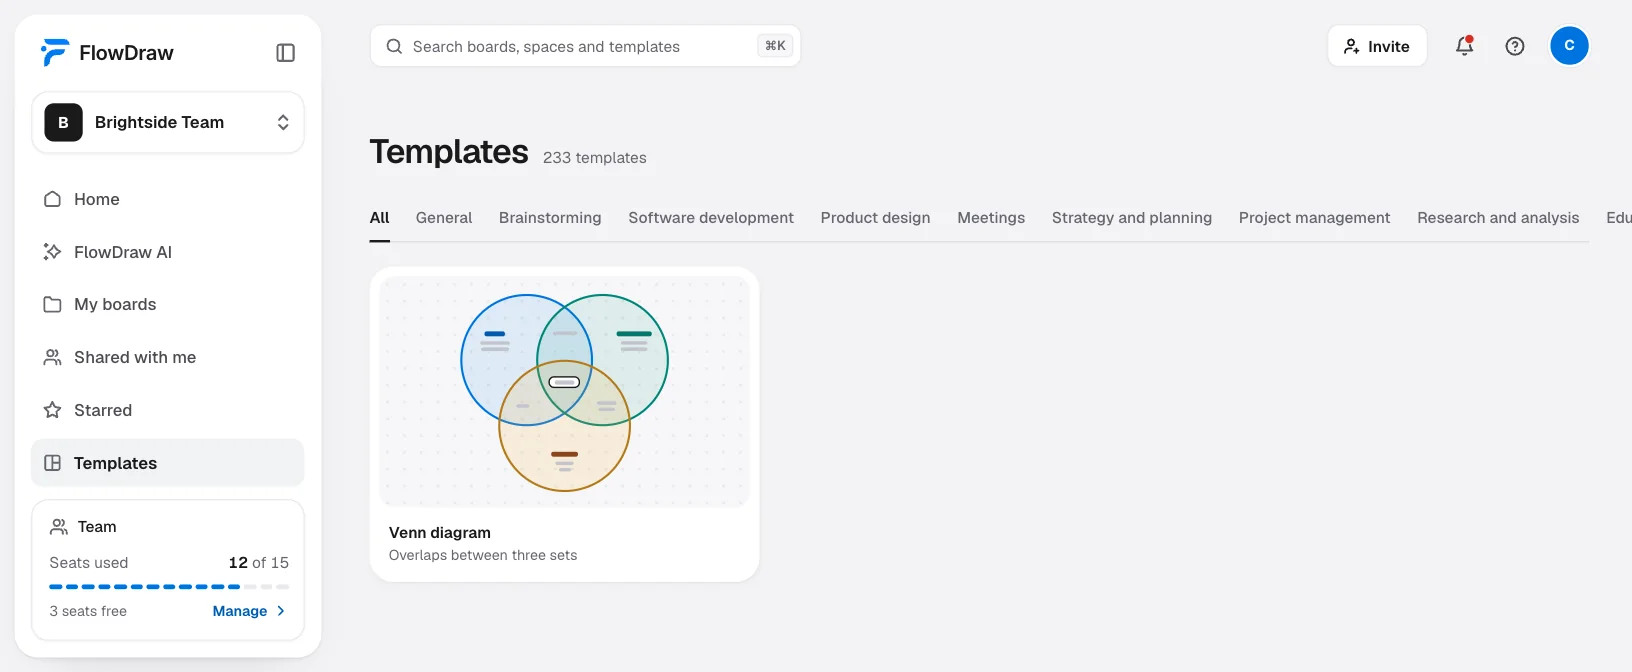
From “Templates” in the sidebar, search for “Venn diagram”, open its preview and choose “Use template”. It is free on every plan and uses 17 of the 150 elements a Free board holds.
Name the sets
Design, Engineering and Business are text boxes. Double-click one to rename it.
Sort the items
Each item is its own text box. Double-click to edit, press ⌘D (Ctrl+D on Windows) to add another, and drag it into its region.
Cut to two circles if you need to
Select the third circle and its text boxes and press ⌫. Remove the Product pill too if nothing belongs to all the sets.
Add color to lines and text
Select a circle and change “Stroke color” in “Shape properties”. Select text and change “Color” in “Text properties”. Picking a “Fill” swatch makes the circle solid, and ⌘Z takes it back.
Group and export
Press ⌘A, then ⌘G, to move everything as one. For a slide, choose “Export”, set “Format” to “PNG” and “Background” to “Transparent”.
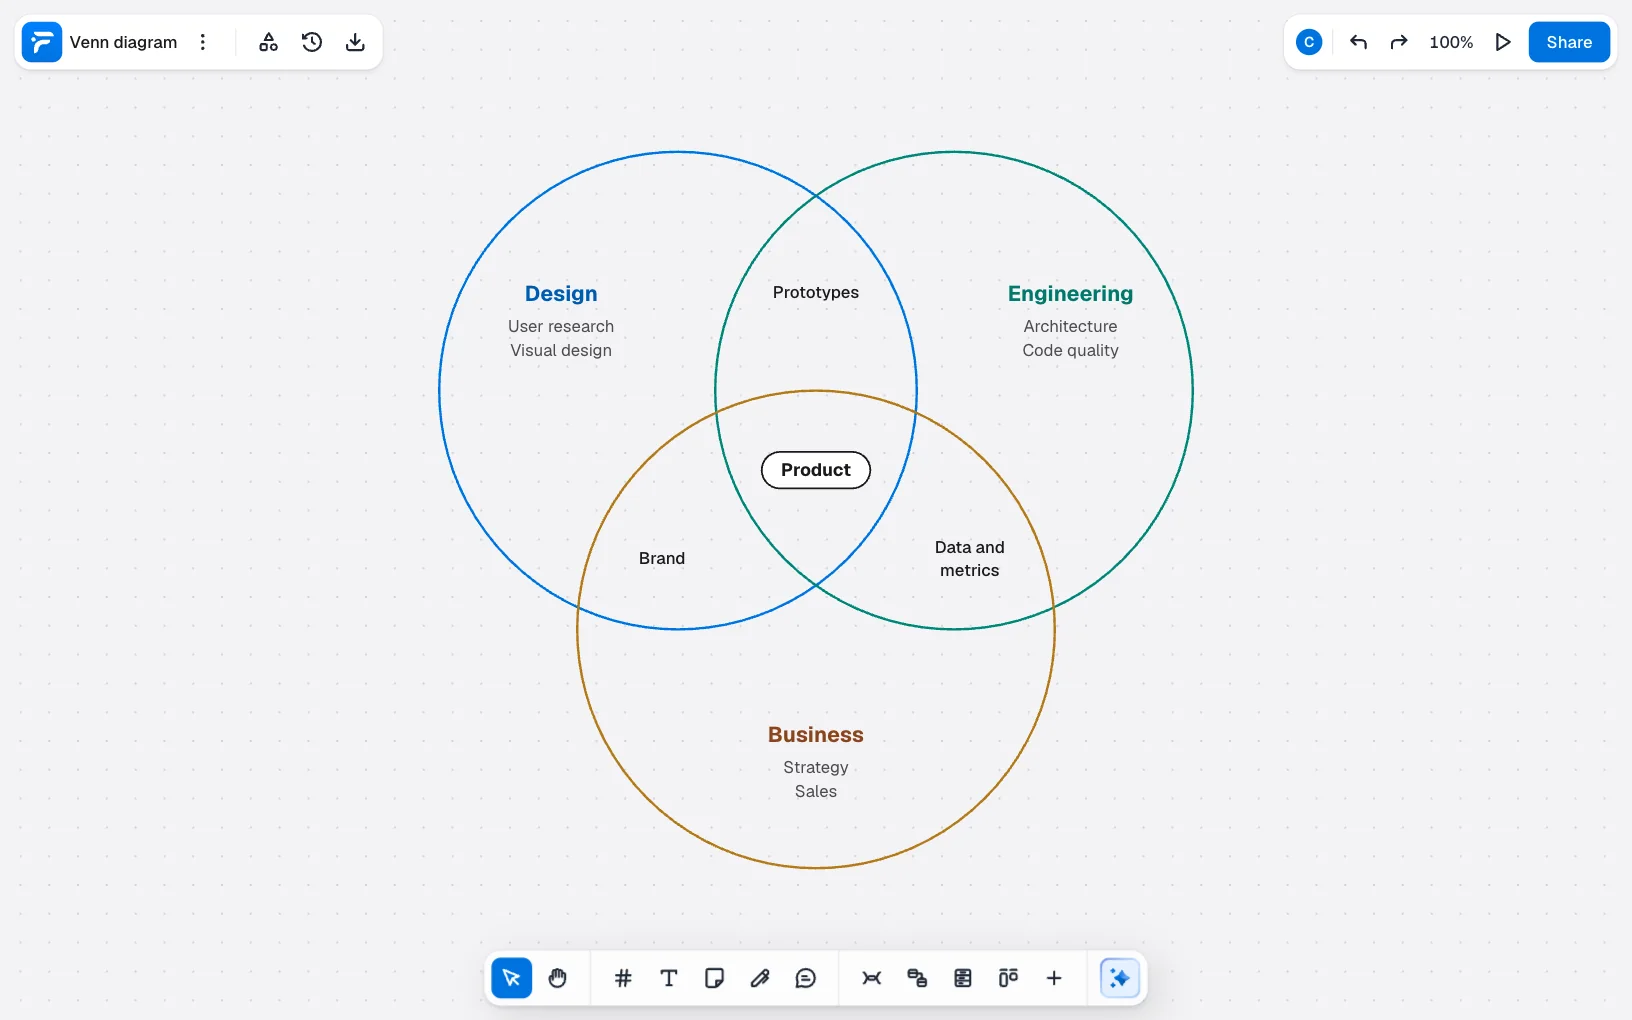
To start from a blank board, or to add a Venn diagram to a board you already have, open “More tools” › “Templates…”, search for “Venn diagram” and click its card. It lands on the board, centered in view.
Need a fourth circle? Duplicate one of these with ⌘D, since a copy keeps its empty fill.
Venn diagram mistakes to avoid
Filling the circles. It looks like a small choice, but each circle covers the edges beneath it. Prototypes now seems to belong to Engineering alone.
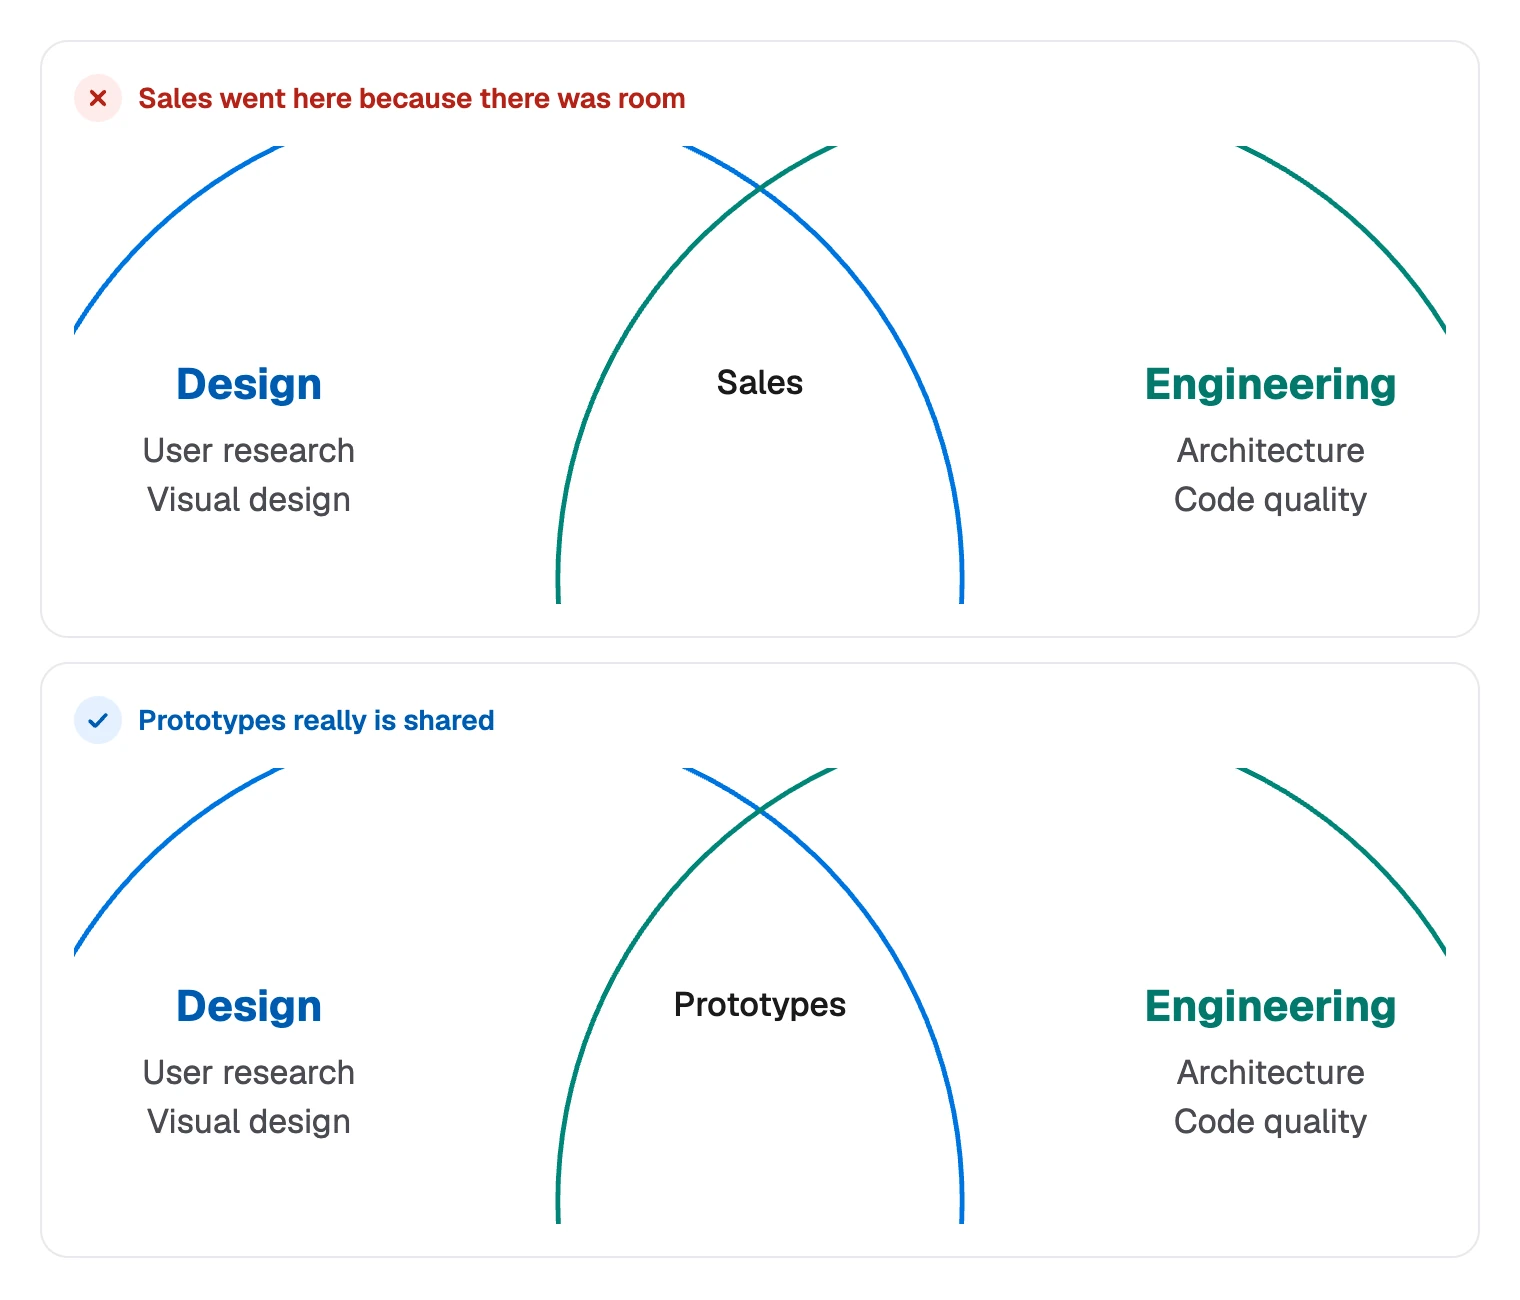
Putting things in an overlap for layout reasons. Every position is a claim. If an item ended up in the middle because there was room, the diagram now says something false.
Too many words in a region. Overlaps are the smallest spaces and often hold the most interesting items. Use short names, and move long lists to a key.
Sets that do not compare. Mixing people, skills and products gives overlaps that mean nothing. All the circles should hold the same kind of thing.
More than three circles. The reader has to trace every edge to find a region. Use a table instead.
Shared ownership with no owner. An overlap can show that two teams care. It cannot show who decides, so write that down too.
If you want to try it, create a free account and start from the template.
FAQ
Two or three work best. Circles alone cannot show every overlap of four sets, so four-set diagrams use ellipses, and they get hard to read. Past three sets, a table is usually clearer.