
How to make a flowchart: a step-by-step guide
Learn how to make a flowchart: what each symbol means, how to plan the steps and how to draw one from a template or with AI, using a checkout example.
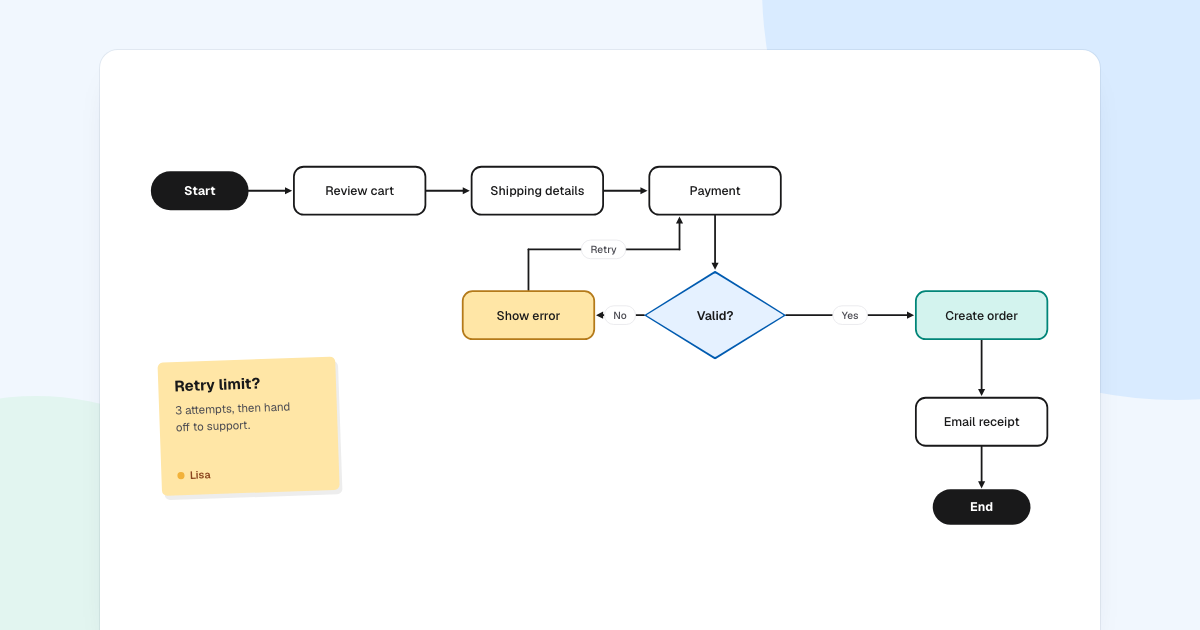
Most flowcharts start as a disagreement about what really happens after someone clicks a button. Drawing the steps settles it. To show how to make a flowchart from a blank page, we will build one for an online checkout.
Quick AnswerTo make a flowchart, write down where the process starts and ends, list the steps in order, and turn every question into a decision with labeled exits. Draw the normal path first, add the other branches, then walk through it with someone who does the job.
What is a flowchart?
A flowchart shows a process as shapes joined by arrows. The shape says what kind of step it is, and the arrows say what comes next.
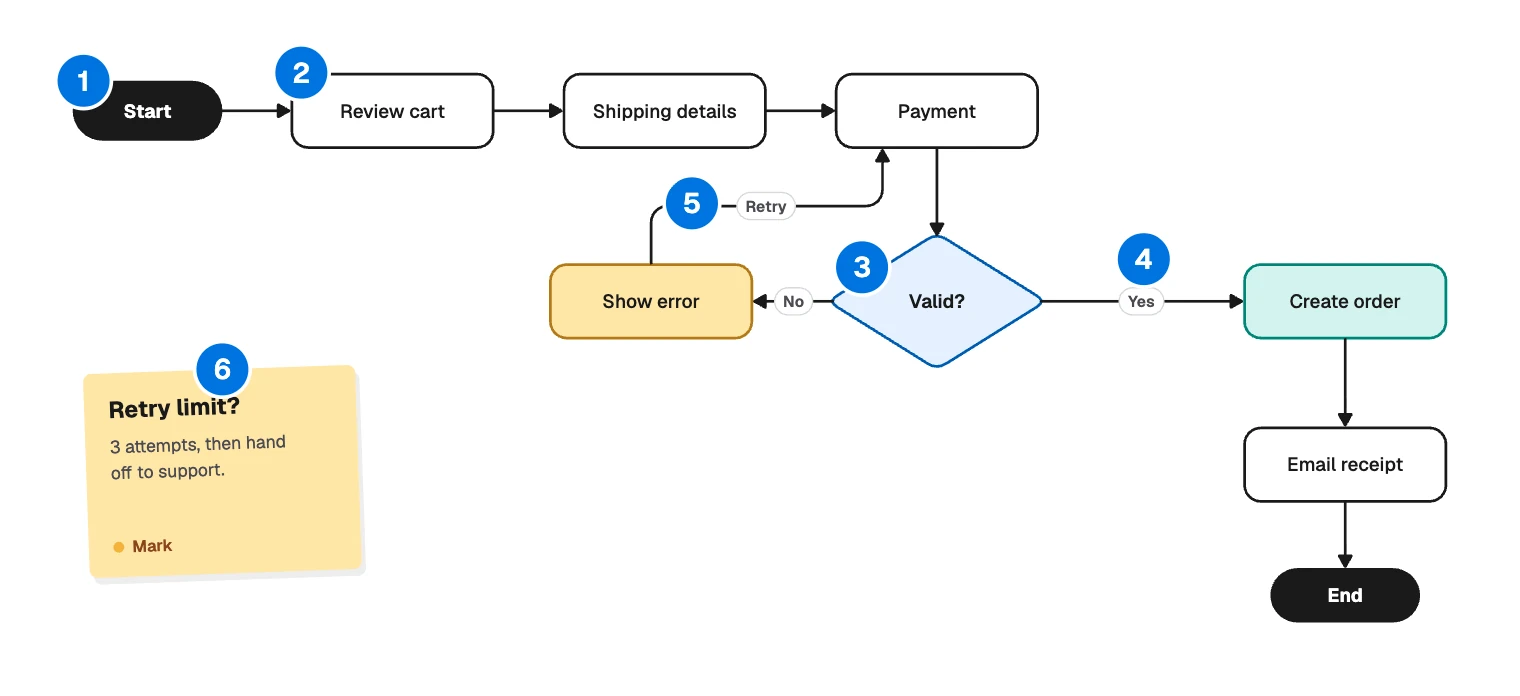
- Start: where the process begins. Each end uses the same pill.
- Step: one action, such as “Review cart”.
- Decision: a question that splits the path.
- Labeled exit: the answer that sends you this way.
- Loop: a path back to an earlier step.
- Note: an open question, kept off the path until someone decides.
Nobody needs training to follow one. Use one when a single process runs in a clear order and you want to see its branches. Other diagrams suit other questions:
- When several teams pass work to each other, a swimlane diagram also shows who holds each step.
- When systems call each other, a sequence diagram shows the messages between them.
- When an order or a ticket sits in statuses that last for days, a state machine diagram shows what is allowed in each one.
Flowchart symbols and what they mean
Four shapes cover most charts.
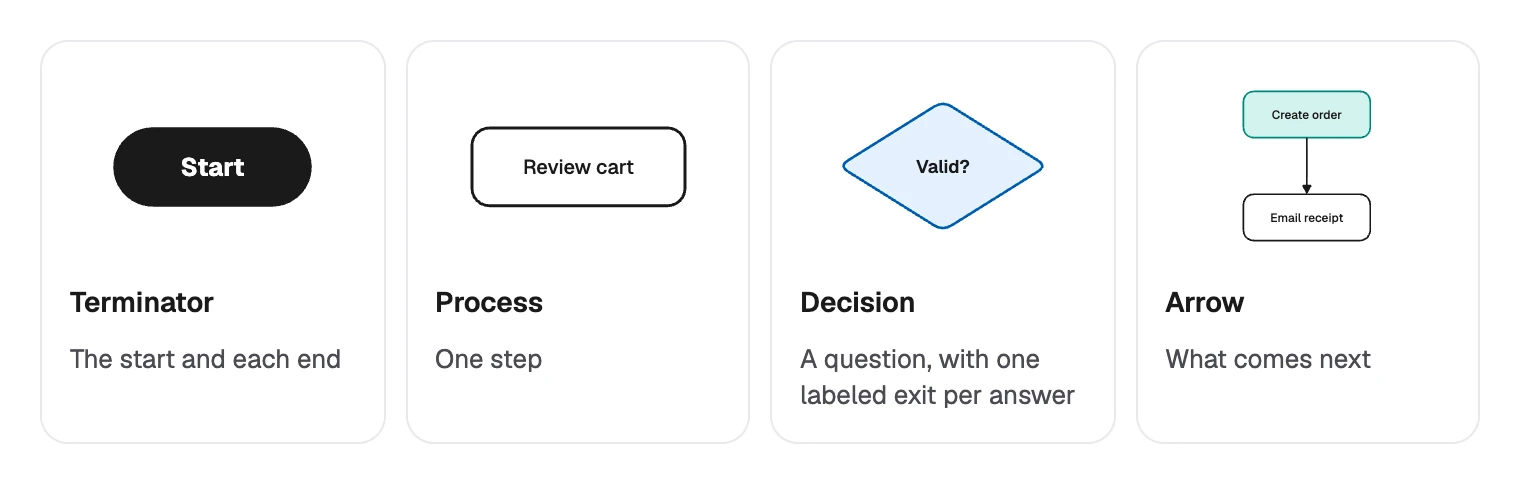
Add the others only when the difference matters to the reader:
| Shape | Name | Use it for |
|---|---|---|
| Parallelogram | Data | Information going in or coming out |
| Rectangle with a wavy base | Document | A form, a report or an email |
| Cylinder | Database | Stored records |
| Box with double side bars | Predefined process | A process on its own chart |
| Small circle | Connector | A jump to another spot on the page |
| Pentagon pointing down | Off-page reference | A jump to another page or chart |
How to make a flowchart
Here is how the checkout flow gets built.
Fix the start and the end
Write one sentence: the customer has items in the cart, and finishes with an order and a receipt. Returns and refunds fall outside it, so they stay off this chart.
List the steps in order
Use one line per action: review cart, enter shipping details, pay, create order, email receipt. A product flow can keep screen names, such as “Shipping details”. Elsewhere, start each step with a verb.
Find the questions
Wherever the answer changes what happens next, you have a decision. Here there is one, did the payment go through, written short as “Valid?“. If you catch yourself saying “it depends”, a decision is hiding there.
Draw the normal path first
Lay out the path where nothing goes wrong. This is the spine of the chart, and readers learn the main story from it.
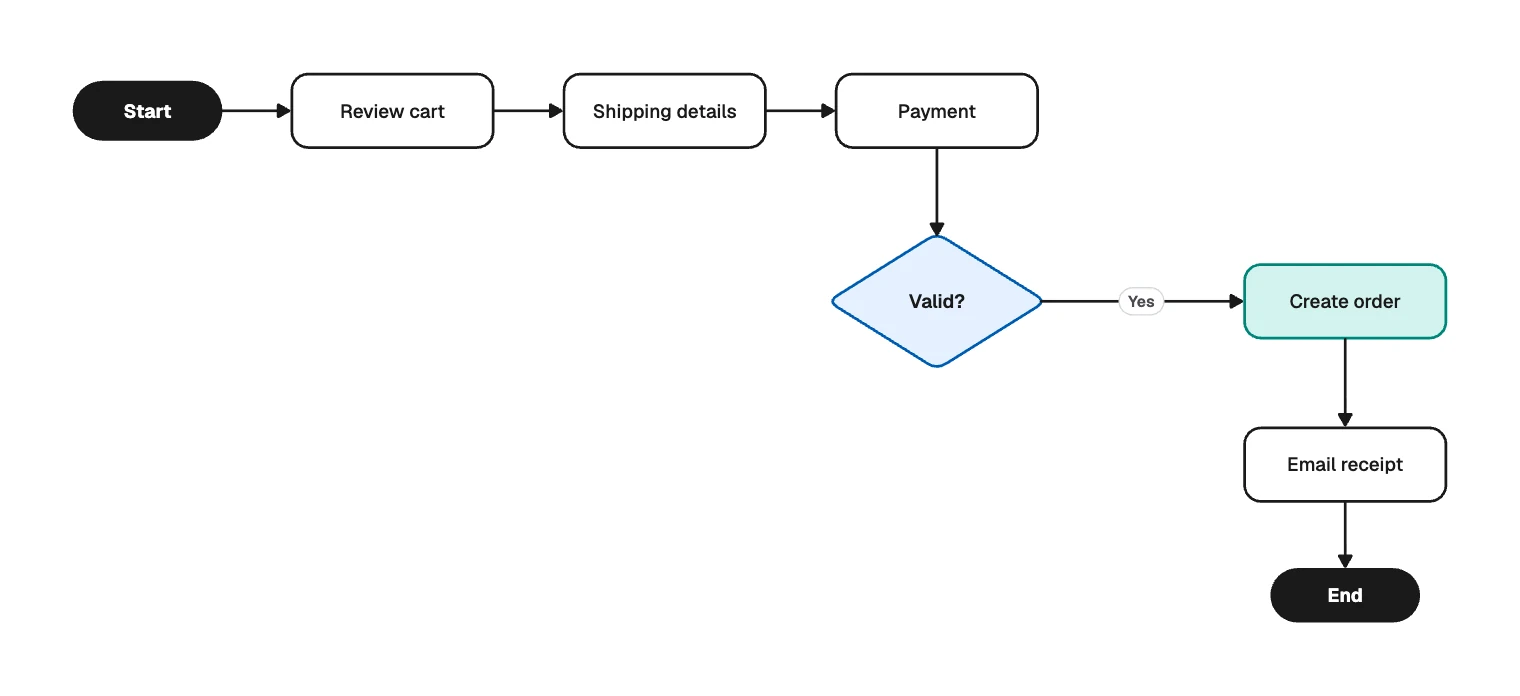
The path where nothing goes wrong Add the other branches
Every exit must lead somewhere. “Retry” returns to “Payment”, not “Start”, because the customer should keep their cart and address. Color can help: this board marks failure amber and success teal.
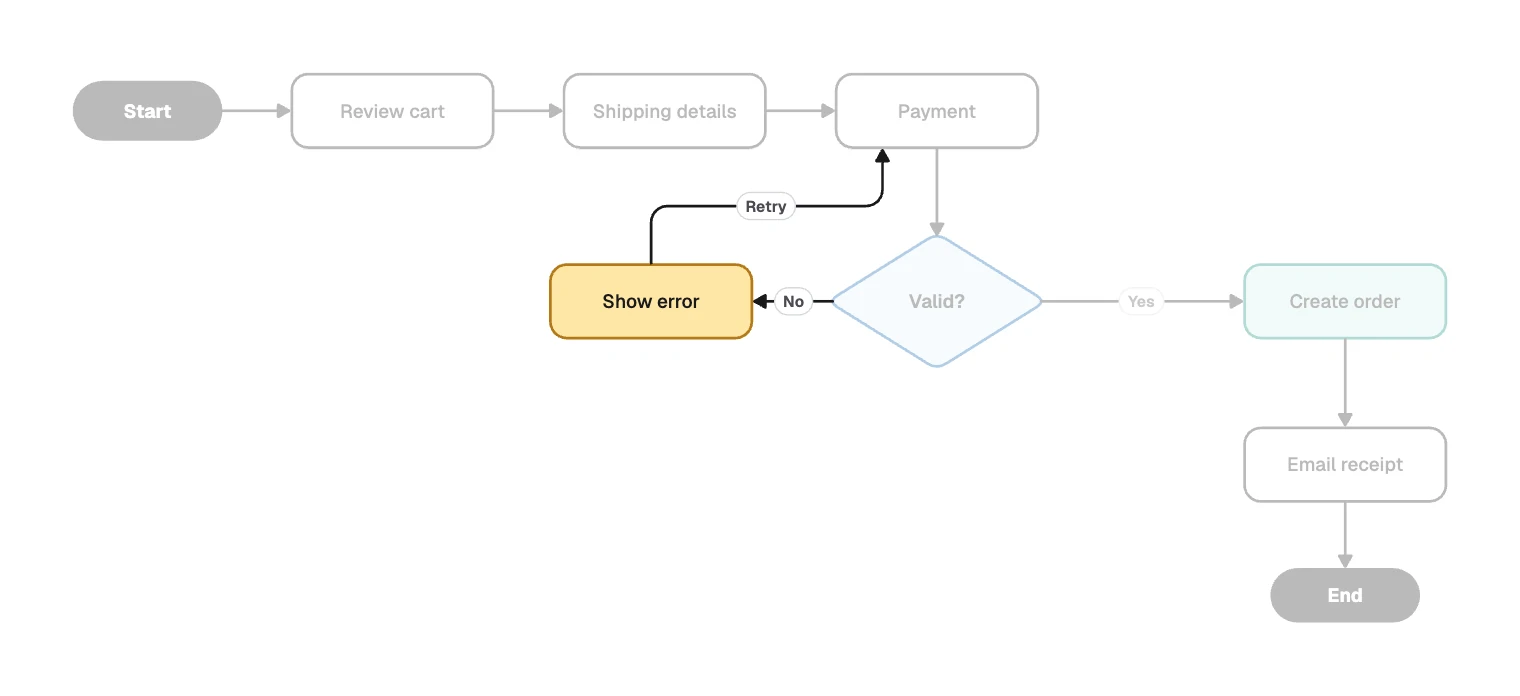
The failure branch joins the spine Walk it with someone who does the job
Read it aloud, step by step. That is how the sticky note on this board comes up, asking for a retry limit. Keep open questions in a note until someone decides, then add the answer as a second decision on the loop.
Make a flowchart in FlowDraw
The “Flowchart” template and the Flowchart shape library are free on every plan.
Open the template
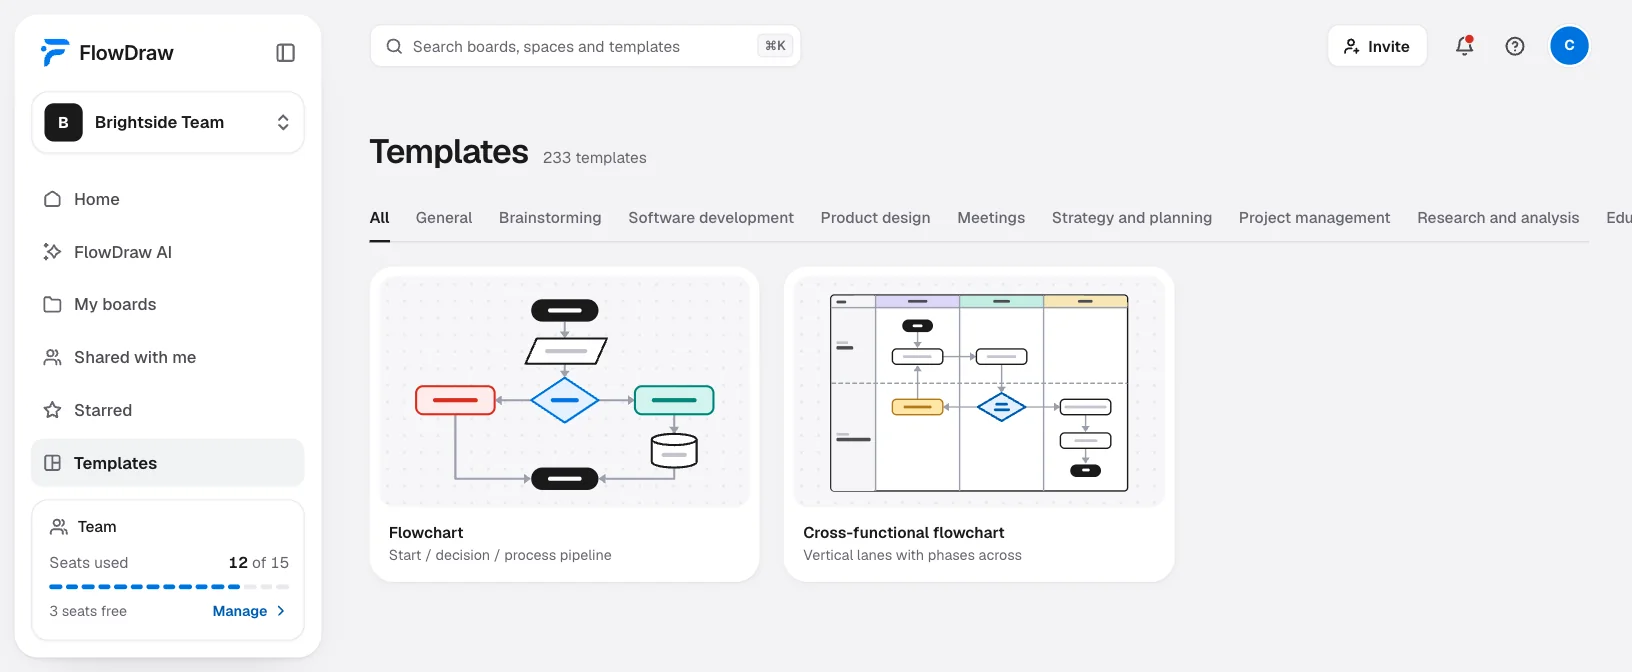
On Home, click the “Flowchart” tile for a new board with the checkout flow. Or click “Templates” in the sidebar, search for “Flowchart”, open the preview and click “Use template”.
Replace the labels
Select a shape and start typing. To rename the board, use “Rename” in the “Board menu”.
Add steps
Hover a shape and a spot appears outside each side. Click one to join a shape in that direction, or to add a copy joined by a line. With nothing selected, press R for a rectangle or D for a decision.
Label the exits
With nothing selected, press L to draw a line. Select any line and type in “Add a label” under “Line properties”. Attached lines route themselves when you move things.
Get it checked
Click “Share”, add people by email and choose “Can comment”, so they can leave notes on the board. “Export” gives you PNG, SVG or PDF on any plan.
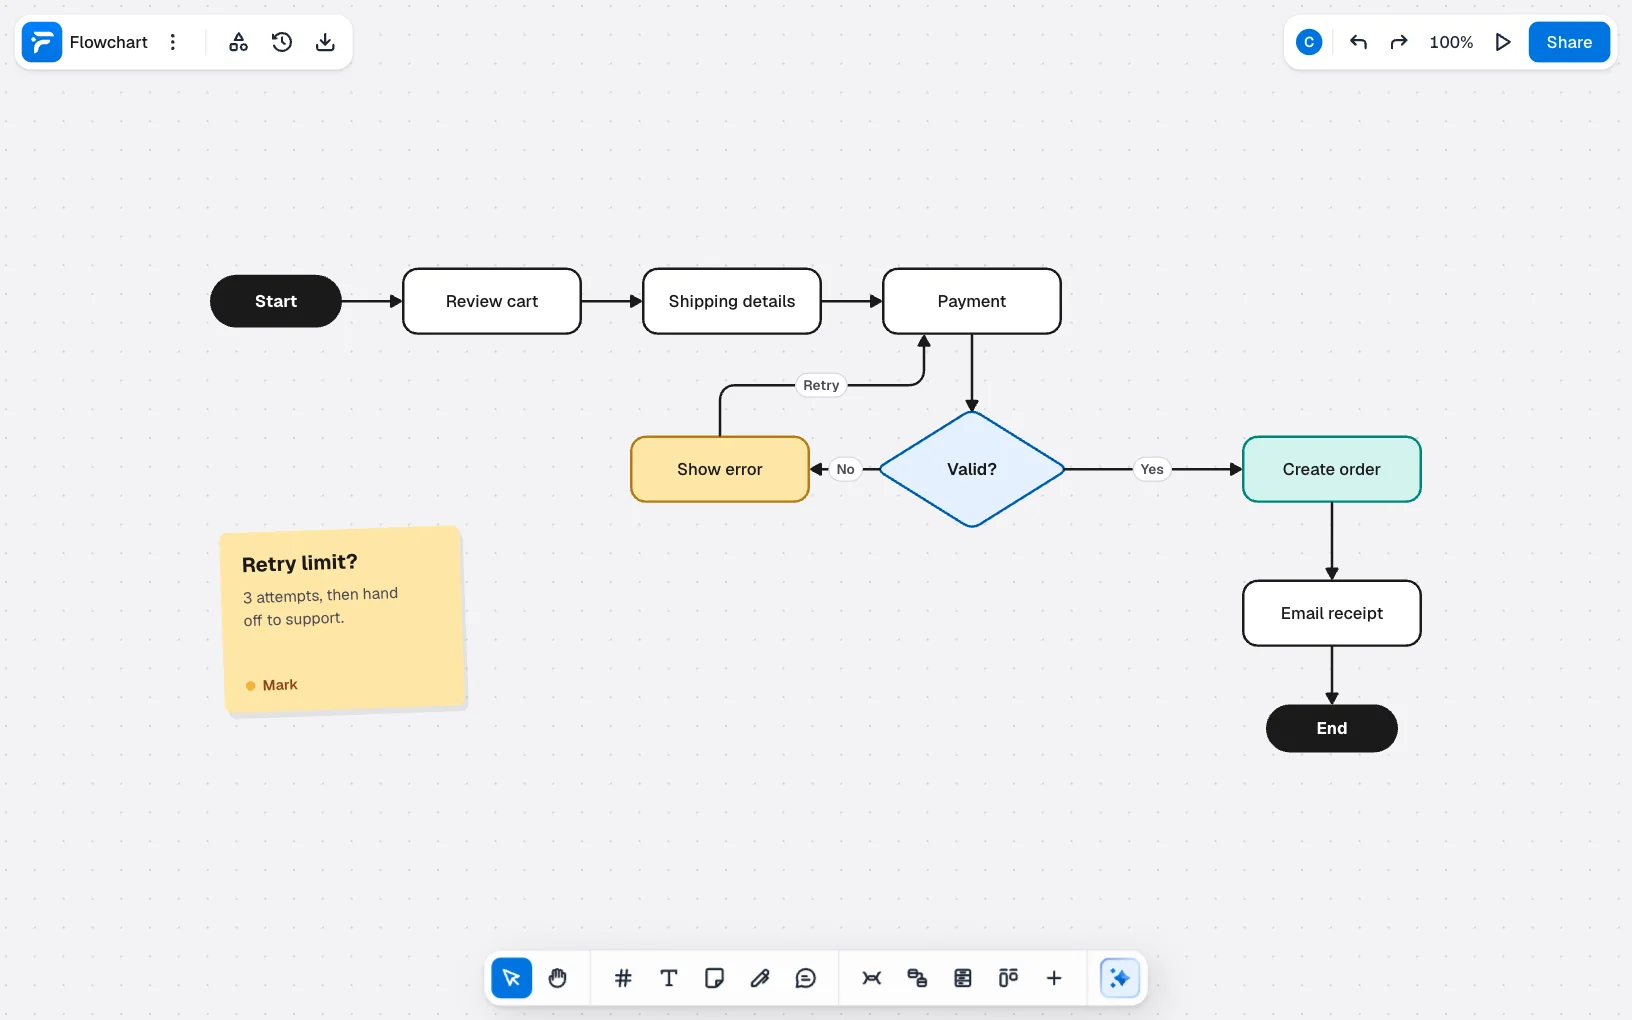
To start empty, click “Blank board” on Home, open “Shape library” in the top bar and use the Flowchart section. On Free a board holds 150 elements, and each shape, line and note counts as one. The checkout flow uses 19.
Draw the first version with AI
If the process already exists in words, FlowDraw AI can draw it. Click “FlowDraw AI” in the sidebar, set “Diagram” to “Flowchart”, describe the process and click “Draw it”. For example:
Flowchart of our checkout. The customer reviews the cart, enters shipping details and pays. If the payment is valid, create the order and email a receipt. If not, show an error and let them retry up to 3 times, then hand off to support.
You get a new board of ordinary shapes to edit, for 10 AI credits. You can also attach a written procedure as a PDF, a Word file, plain text or CSV.
To change the chart later, press ⌘J (Ctrl+J on Windows) to open “Ask AI” and say what should change. The whole change is one undo step.
Common flowchart mistakes
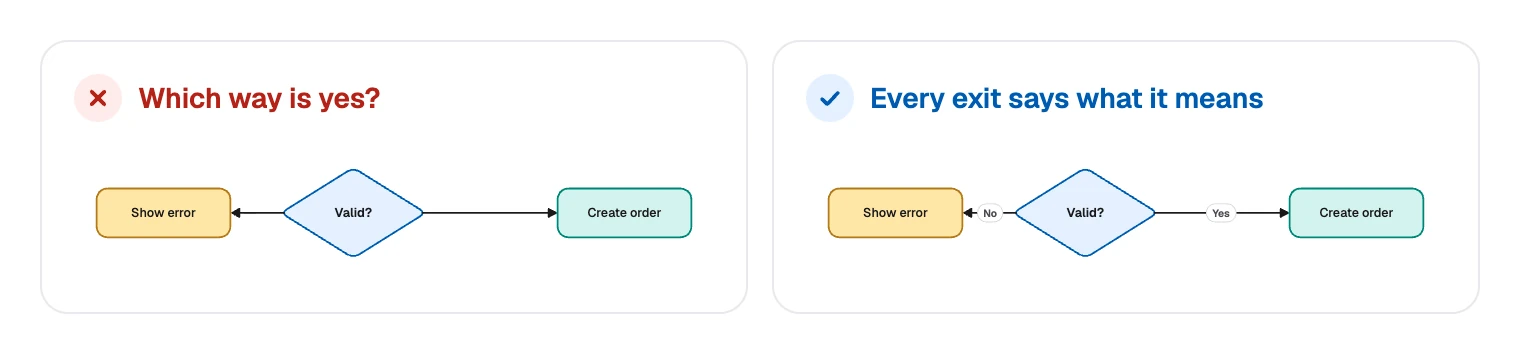
Exits with no labels. A diamond with two bare arrows makes the reader guess.
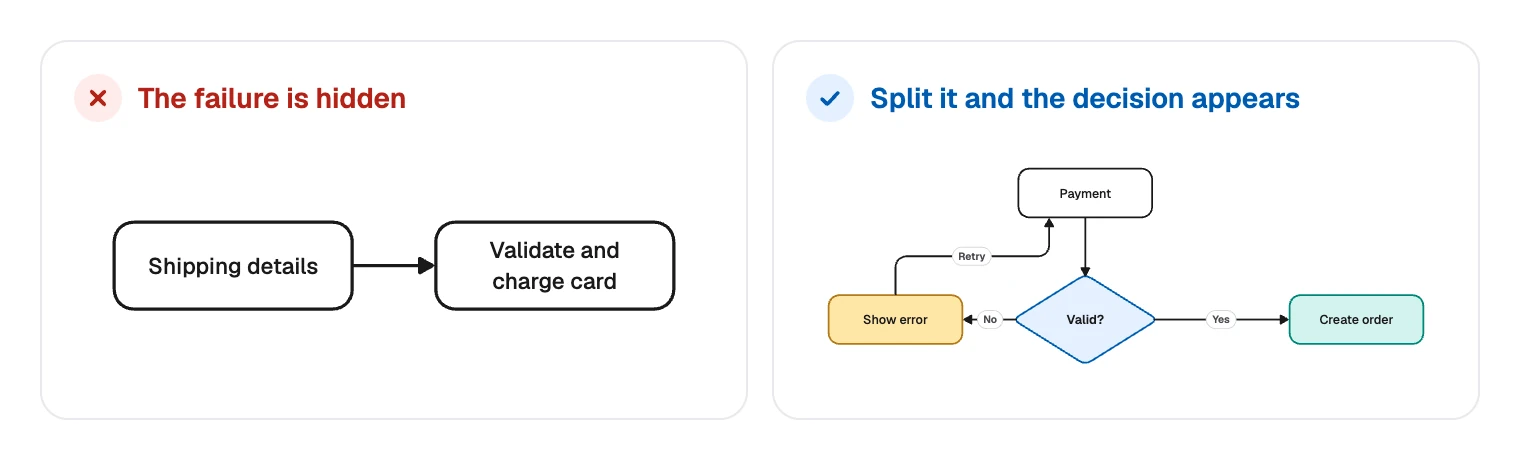
Two actions in one box. “Validate and charge card” hides the moment the card can fail.
- Loops with no way out. Ask what stops the loop. The checkout board still has this problem, and its sticky note says so.
- Mixed levels of detail. “Payment” beside “Trim spaces in the card field” serves neither reader. Point to the detail with a predefined process.
- Only the happy path. Failed payments and timeouts are usually why someone opened the chart.
- Symbols nobody can read. A chart with ten kinds of shape needs a legend.
To try this on your own process, create a free account and click the “Flowchart” tile on Home.
FAQ
Four cover most charts. A pill marks the start and each end, a rectangle is a step, a diamond is a question with labeled exits, and an arrow shows what comes next. Add others, such as a parallelogram for data, only when the difference matters.