
How to make a project timeline
Learn how to make a project timeline: pick milestones, get honest dates, choose a scale and draw one in FlowDraw, and see when a Gantt chart fits better.
Most people who look at your project want one answer: what happens when. A project timeline gives it on a single line, with far less detail than a full plan. Knowing what to leave out is most of the skill, so start there.
Quick AnswerA project timeline shows a project’s key events in date order along one line. To make one, list the milestones that matter, date them from the work behind them, place them along a rail, and label each with its date, name and outcome. Update it whenever a date moves.
Project timeline, Gantt chart or roadmap?
These get mixed up, and each one leaves out something different. A timeline is the simplest of them:
| You need to show | Use | What it leaves out |
|---|---|---|
| Key dates, for people outside the team | Project timeline | Tasks and who does them |
| Tasks, durations, overlaps and dependencies | Gantt chart | Easy reading at a glance |
| Direction over quarters, with dates still flexible | Roadmap | Exact dates |
| What is being worked on this week | Kanban board | The long view |
Start with a timeline when your readers are clients, leaders or other teams, who mostly need the shape of the plan.
What goes on a project timeline
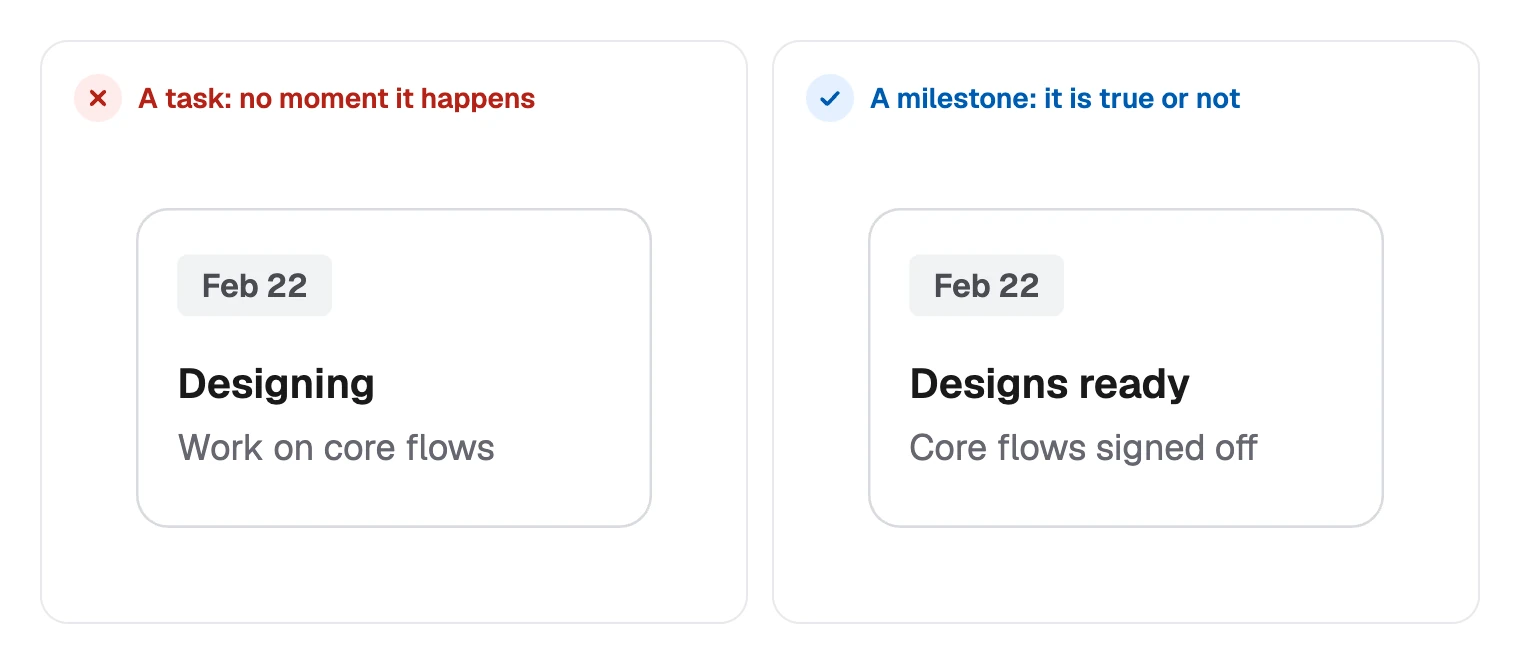
A timeline holds milestones, not tasks. A task is work over time. A milestone is the moment something becomes true. The test: could you say on a given day whether it has happened?
The drawing itself is a few simple parts:
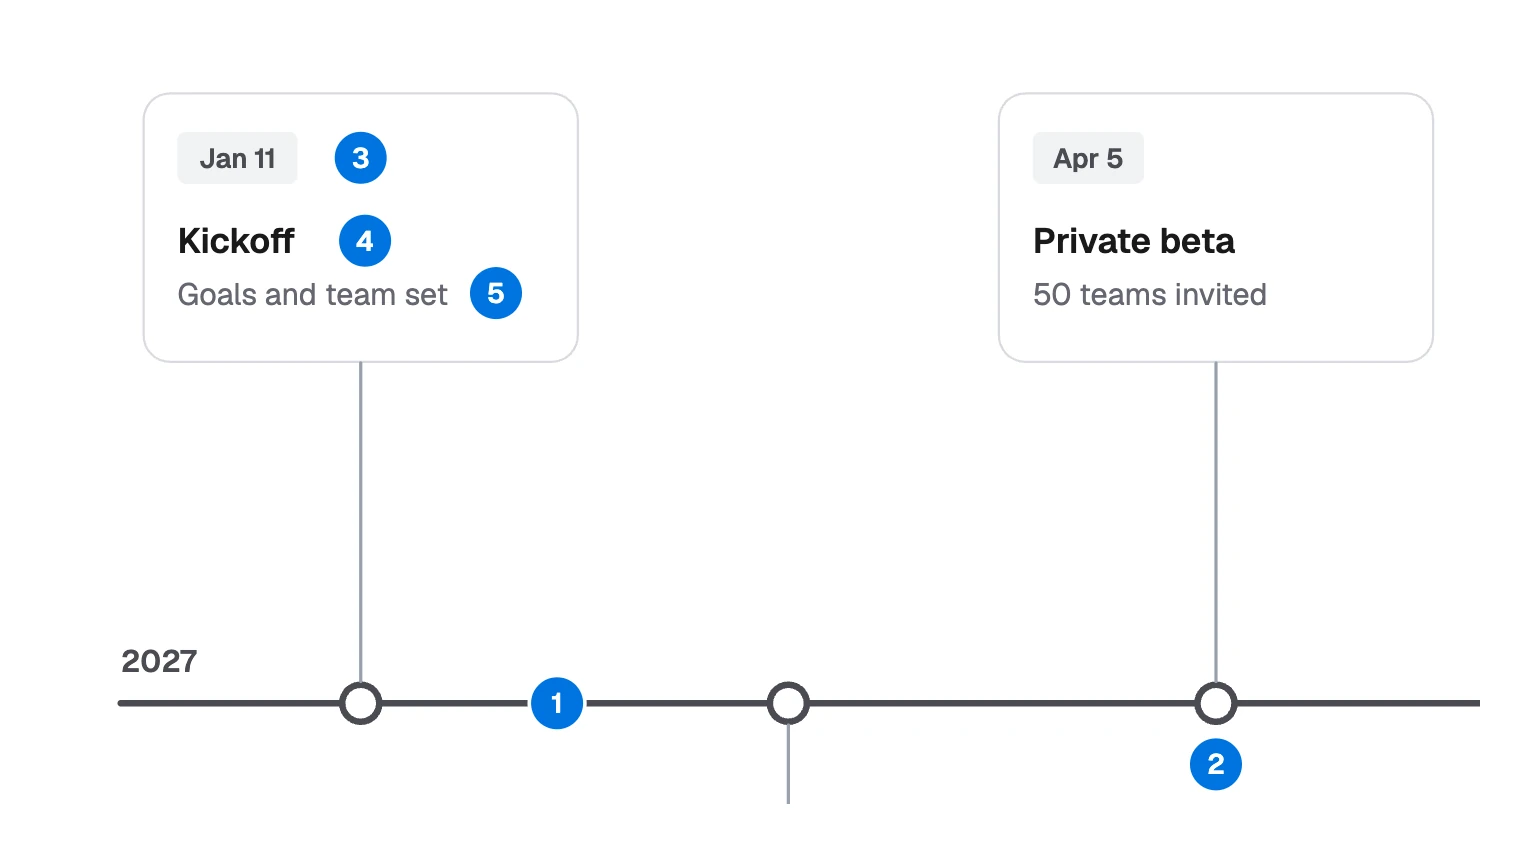
- Rail: the line that stands for time.
- Marker: the spot for one milestone on the rail.
- Date: when it happens.
- Name: what becomes true.
- Outcome: how you will know it did.
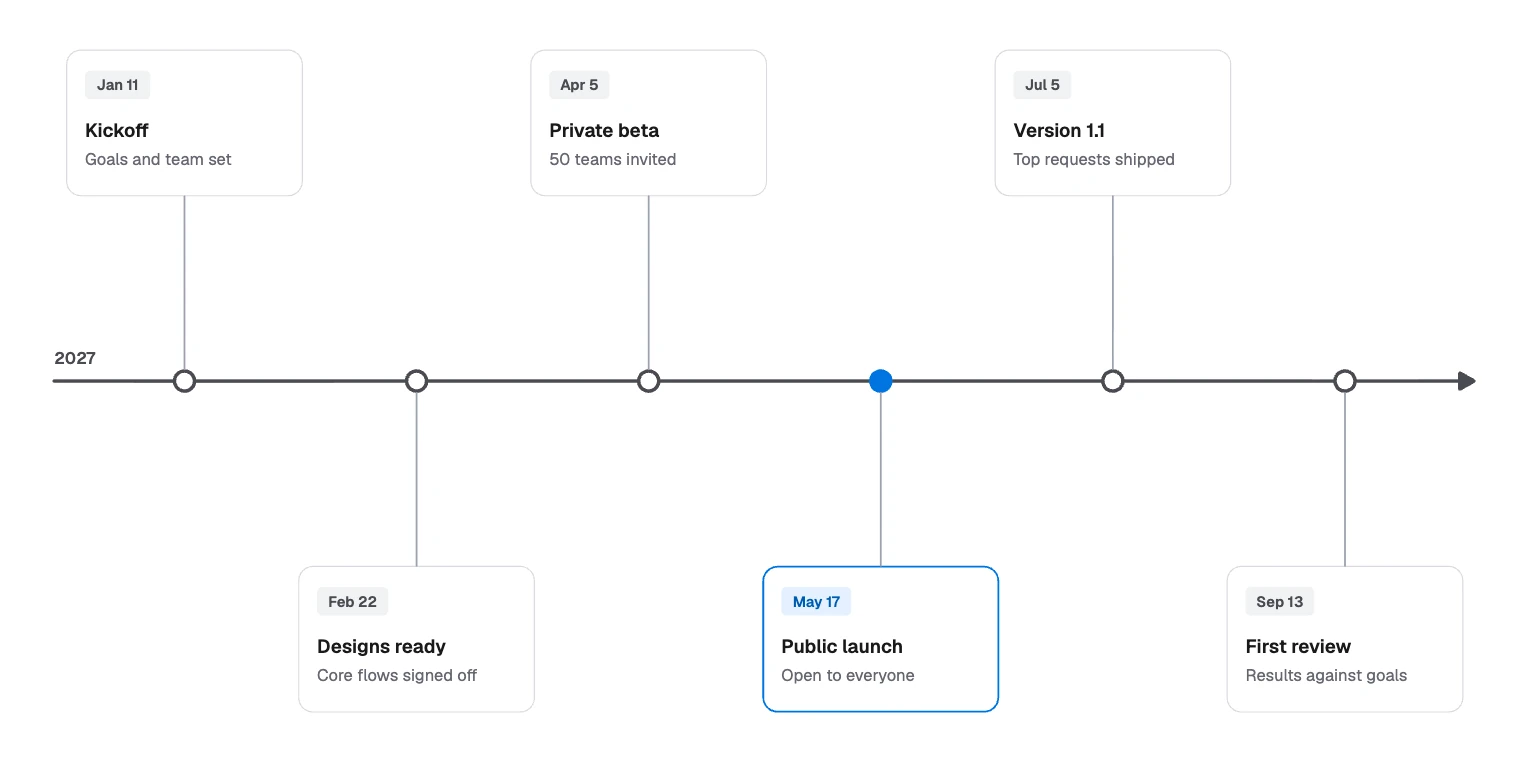
What the Product launch 2027 example gets right
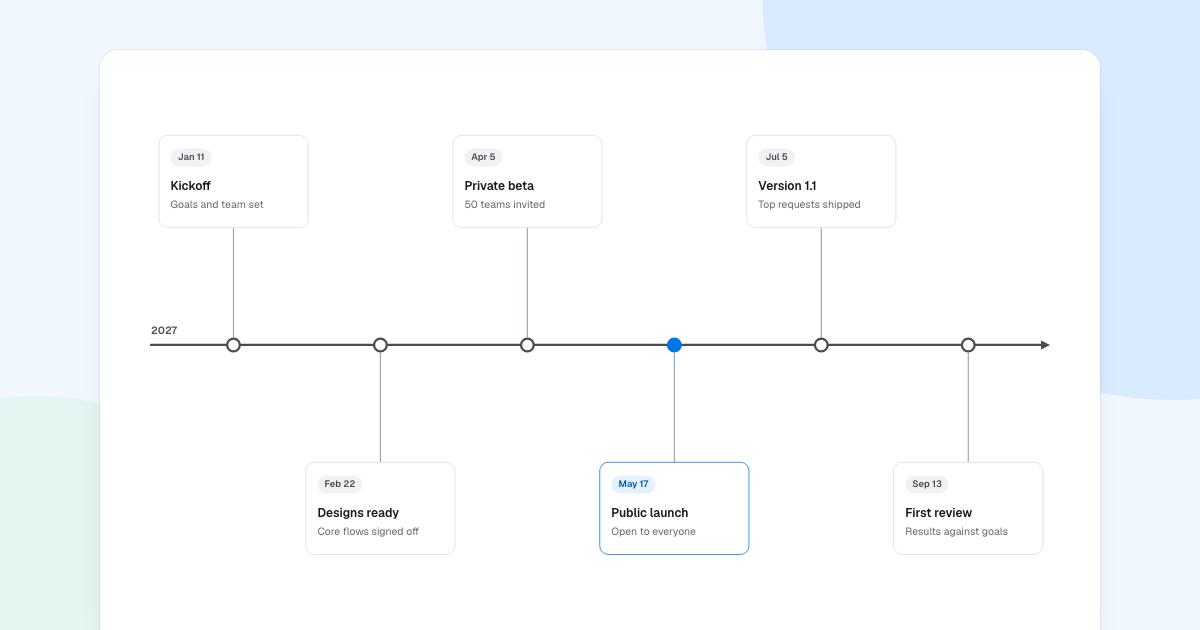
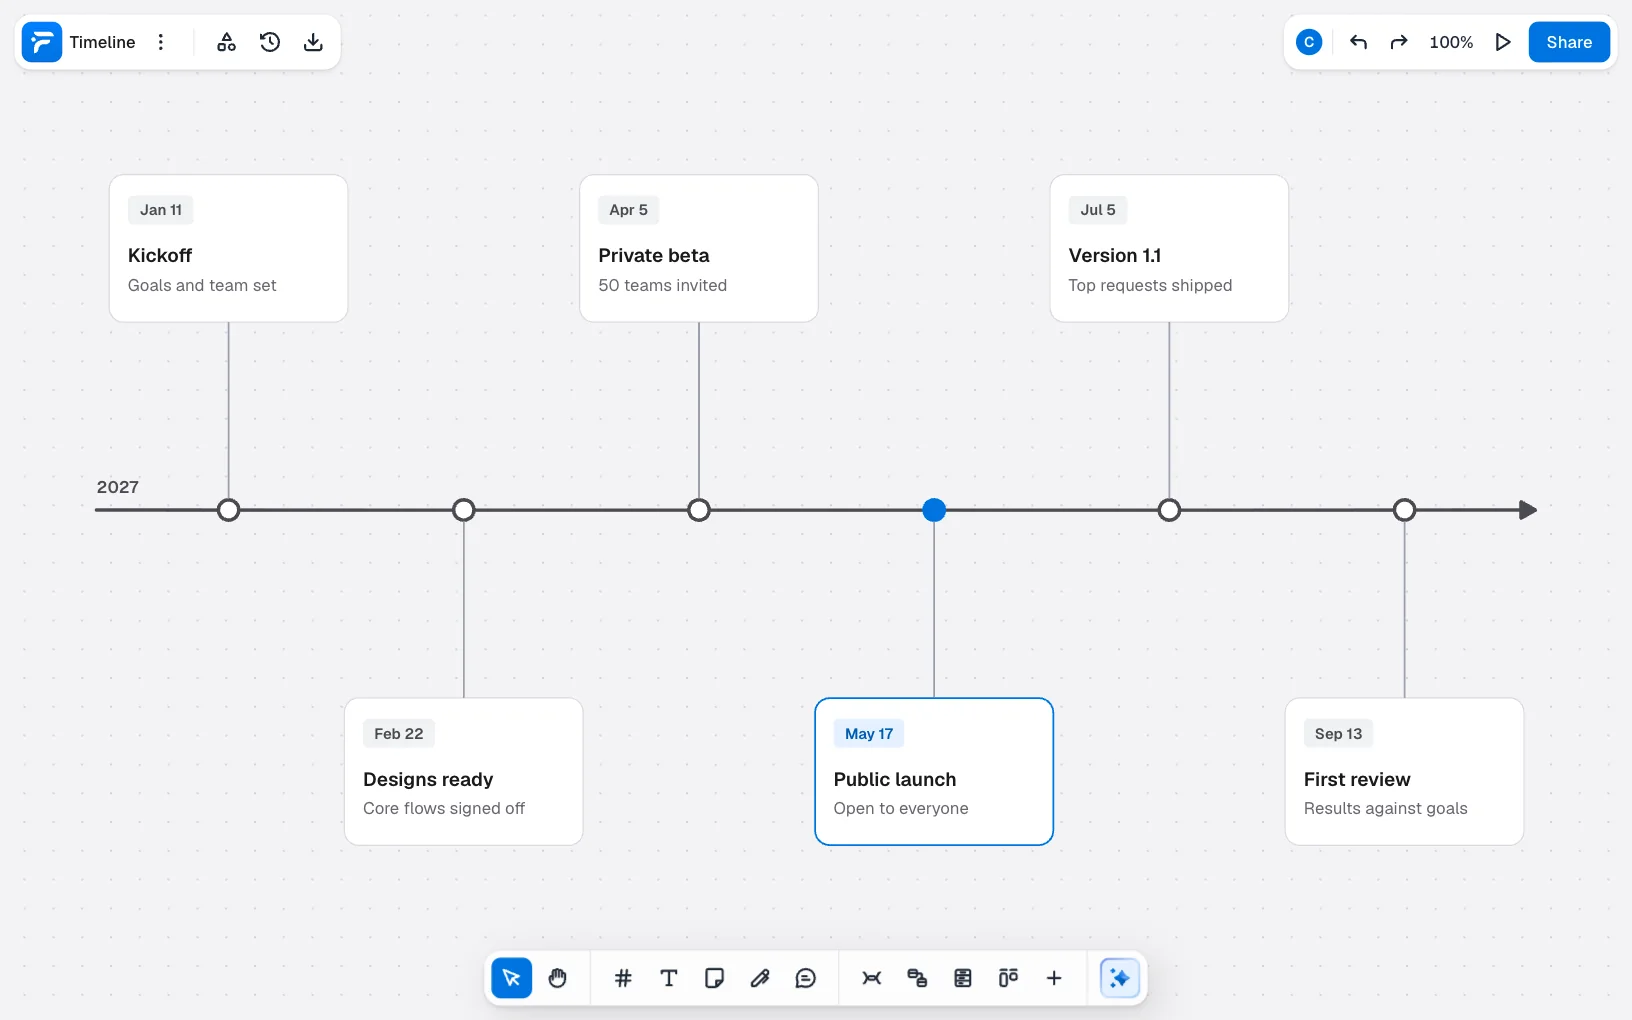
FlowDraw’s “Timeline” template comes with this sample. The launch is made up, so the dates and numbers are placeholders.
| Date | Milestone | Outcome |
|---|---|---|
| Jan 11 | Kickoff | Goals and team set |
| Feb 22 | Designs ready | Core flows signed off |
| Apr 5 | Private beta | 50 teams invited |
| May 17 | Public launch | Open to everyone |
| Jul 5 | Version 1.1 | Top requests shipped |
| Sep 13 | First review | Results against goals |
There are a few things here to borrow, and one to watch:
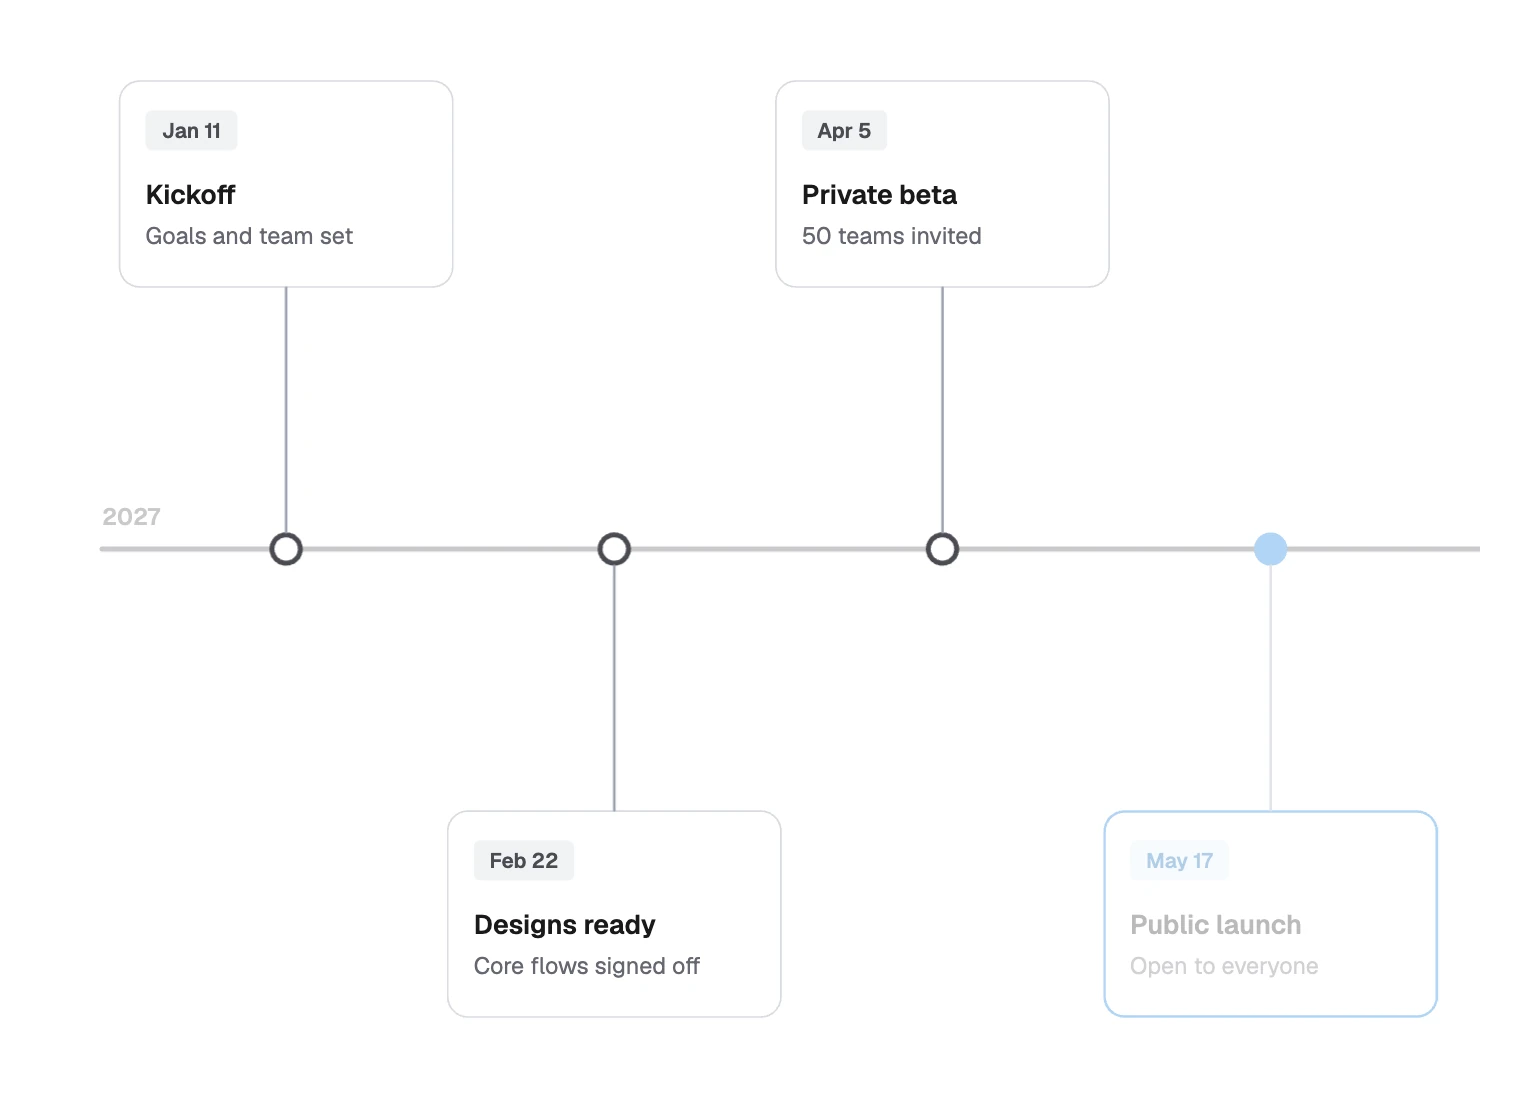
- Every card has an outcome. “Private beta” alone could mean anything. “50 teams invited” tells you when it counts as done.
- Cards alternate above and below the rail. That leaves room for the words without shrinking them.
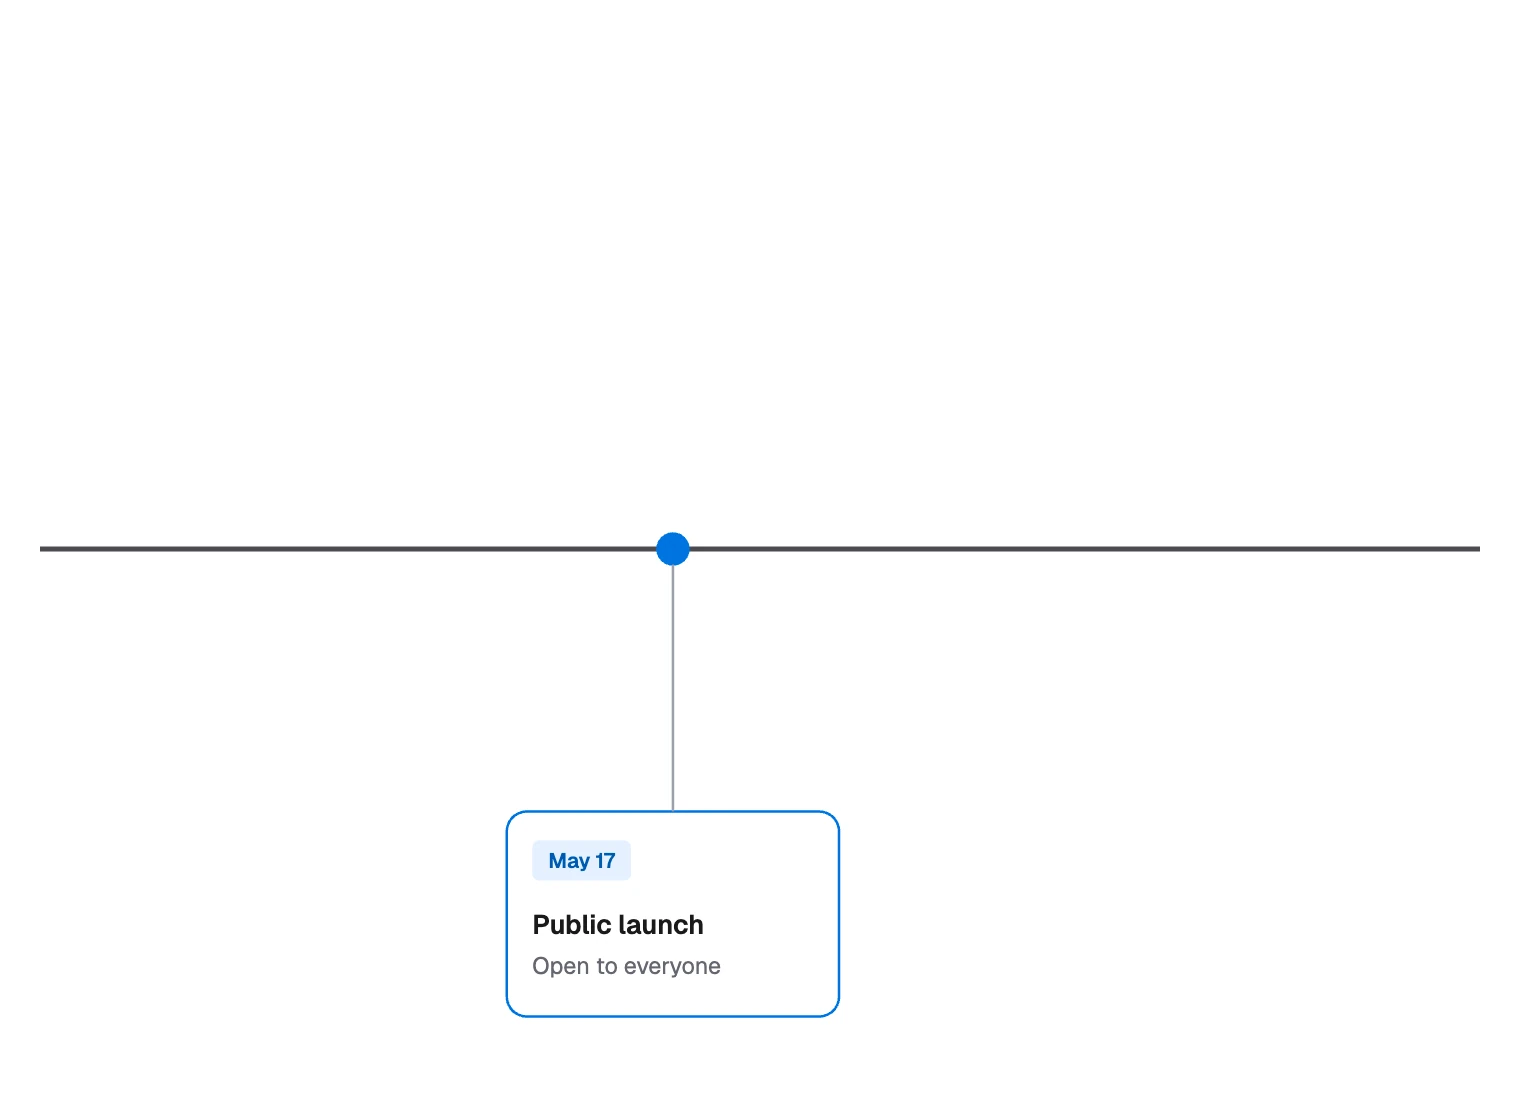
- One milestone stands out. Public launch has a blue outline and a filled marker, because everything else aims at that date.
- The line does not stop at launch. Version 1.1 and First review keep the follow-up work in sight.
- The spacing is even, but the dates are not. The gaps run six weeks, six weeks, six weeks, seven weeks, then ten. That is fine for order, but if pace matters, space the markers to scale.
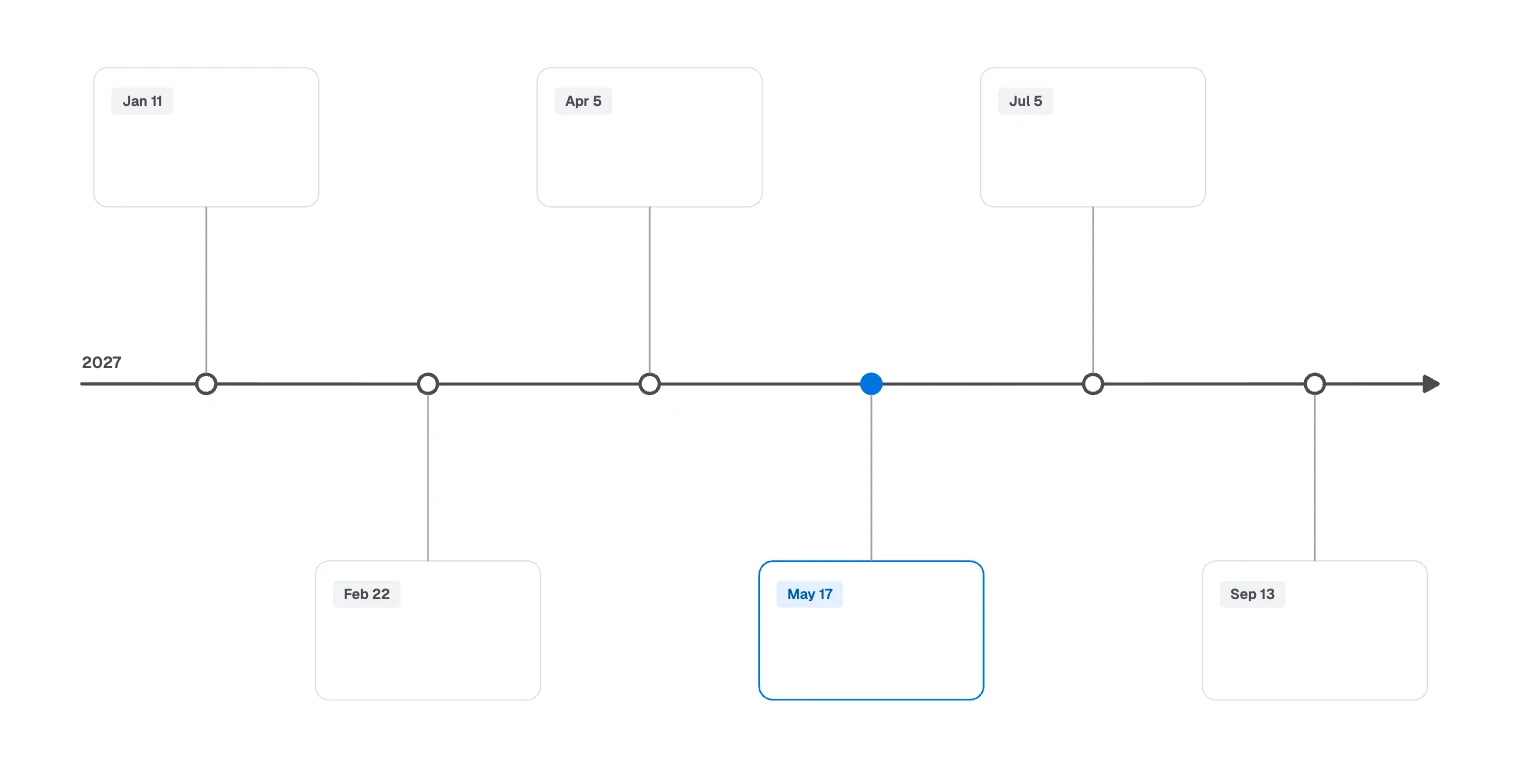
How to make a project timeline
- Start with what is fixed. A contract date, an event or a promised release goes on first, and the rest works backward from it.
- List the milestones. Include each point someone outside the team would care about. Five to nine usually fit on one page.
- Get dates from the people doing the work. Estimate the tasks behind each milestone and check what depends on what. A date that comes only from a wish is a target, so label it that way.
- Leave slack. Put some room before anything fixed, because something will slip.
- Choose a scale. Weeks suit a quarter, and months suit a year.
- Show uncertainty honestly. “Late April” is better than a precise date you do not believe.
- Agree who updates it. Name one person, and write the date of the last update on the timeline.
Making the timeline in FlowDraw
A timeline in FlowDraw is a drawing on a board. The dates are plain text, so nothing moves when one changes and nothing reminds anyone. Use it to show a plan, and keep the working schedule wherever your team runs it.
Open the template
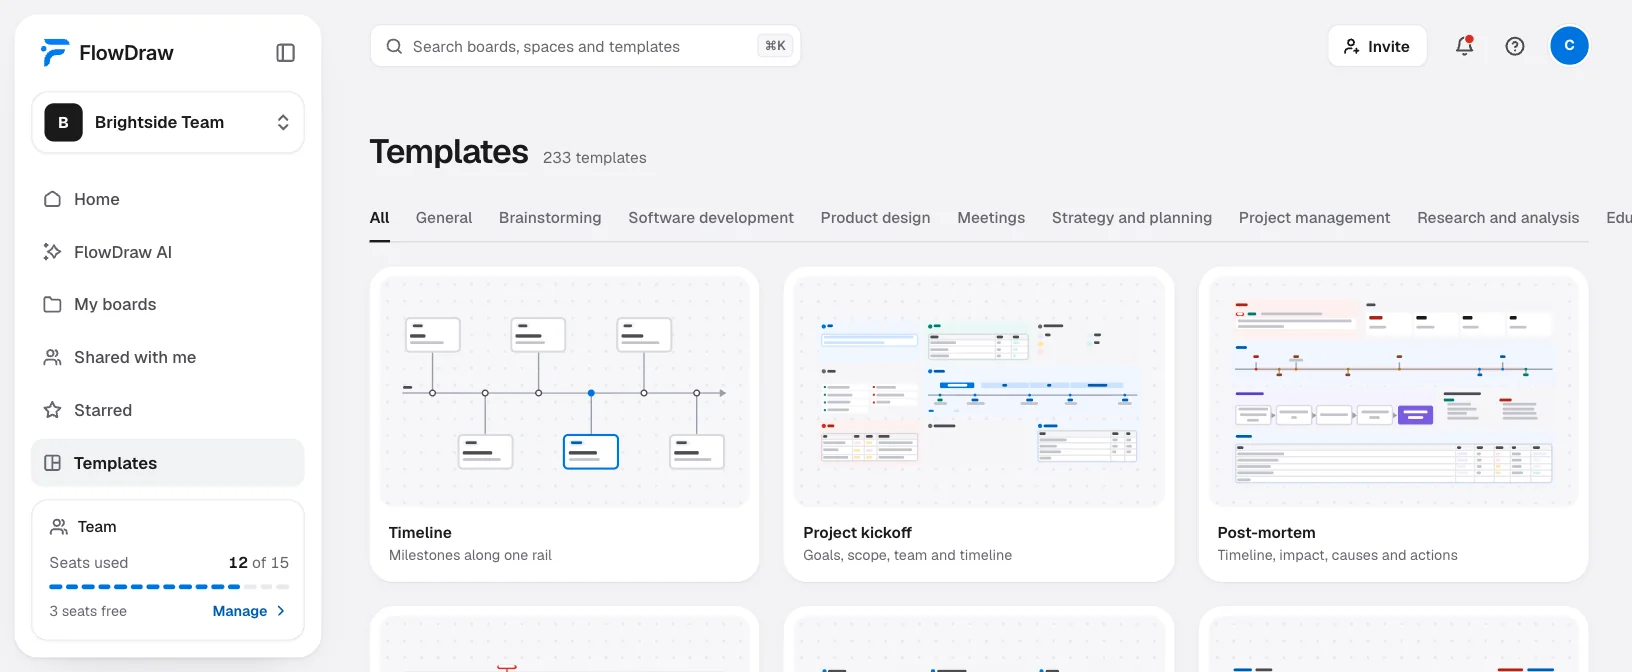
In the sidebar choose “Templates”, search for “Timeline”, open the card with that exact name and choose “Use template”. It is free on every plan, and uses 38 of Free’s 150 elements per board.
Name the board
A new board takes the template’s name, and search looks at titles, not board text. Rename it from the “Board menu”.
Edit the cards
Date, name and outcome are separate text boxes. Double-click one to change it.
Add a milestone
Shift-click a card, its text boxes, its stem and its marker, then press ⌘D (Ctrl+D on Windows) and drag the copy along the rail. Grouping the parts first with ⌘G keeps them together.
Stretch the rail
The rail is one connector with free ends. Select it and drag an end.
Highlight what matters
Select a card or a marker and change “Stroke color” or “Fill” in “Shape properties”.
Send it out
“Export” gives you “PNG”, “SVG” or “PDF” on every plan. “Share” › “Copy link” works for people who sign in. For a page anyone can open without an account, use the “Embed” tab and “Copy code”.
An embed is read-only and shows the board as it is when the page loads. “Project timeline”, in the same search, adds phases if you need them. Search for “Gantt chart” or “Project roadmap” if you decided on one of those.
Starting blank takes a little longer: choose “Blank board” on Home, then press L and drag for the rail, O for a marker, R for a card and T for text, with Esc between them.
FlowDraw AI does not draw a timeline like this one. It can draw a schedule as a table, which is a fair way to collect dates before you place them on the rail.
Common project timeline mistakes
| Mistake | What to do instead |
|---|---|
| Tasks in place of milestones | Ask what becomes true when “Designing” or “Testing” ends |
| Too many milestones | Split into phases, or move the detail to a Gantt chart |
| Exact dates for things nobody knows | Use a month or a range until the date firms up |
| Spacing that misleads | Say so, or draw it to scale. A long gap is often where the risk is |
| No slack before a fixed date | Leave room, since one slip would move the launch |
| Two versions of the truth | Name an owner and show the last-updated date |
Ready to draw yours? Create a free account and open the “Timeline” template.
FAQ
The project name, a rail with a clear start and end, the milestones in date order, and for each milestone a date, a name and a short outcome. Add the date of the last update so readers can tell how fresh it is.