
How to draw a cloud architecture diagram
How to draw a cloud architecture diagram from the outside in: region, VPC, subnets, servers and traffic, with a three-tier AWS example to copy in FlowDraw.
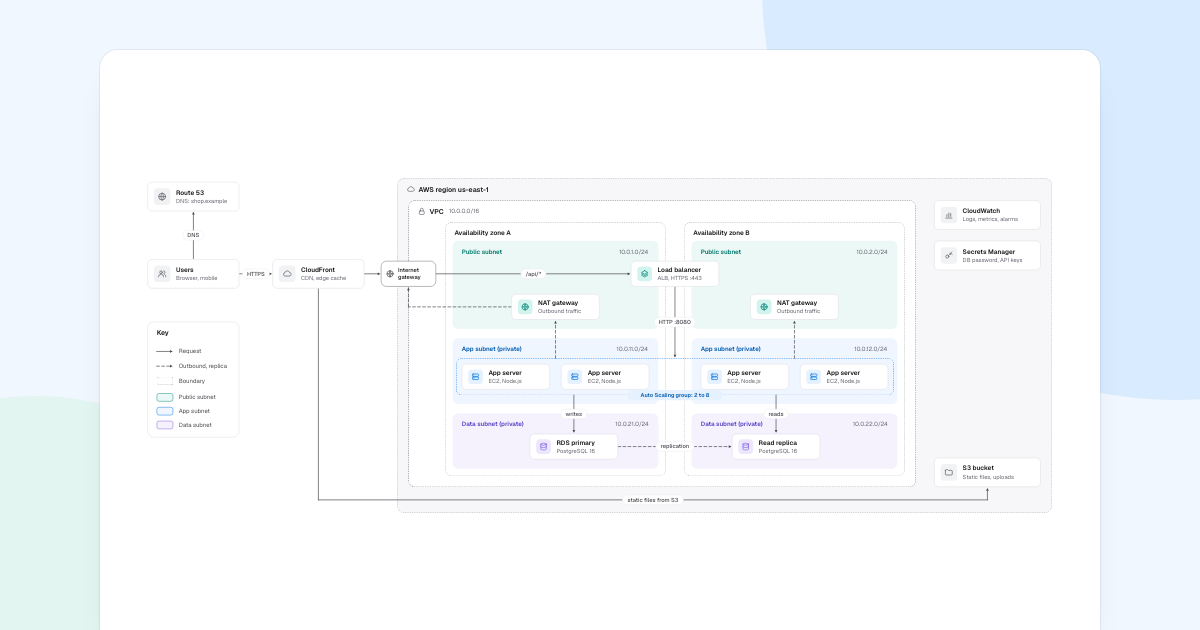
Start with the network, not the servers. A cloud architecture diagram is useful when someone can see where each part runs and who can reach it, and those answers live in the boundaries. The example is a three-tier web app on AWS.
Quick AnswerA cloud architecture diagram shows what runs where in the cloud and how traffic moves between the parts. Draw it from the outside in: region, network, zones and subnets. Then place each service inside its boundary, trace the request path, and add a key for your line styles.
What is a cloud architecture diagram?
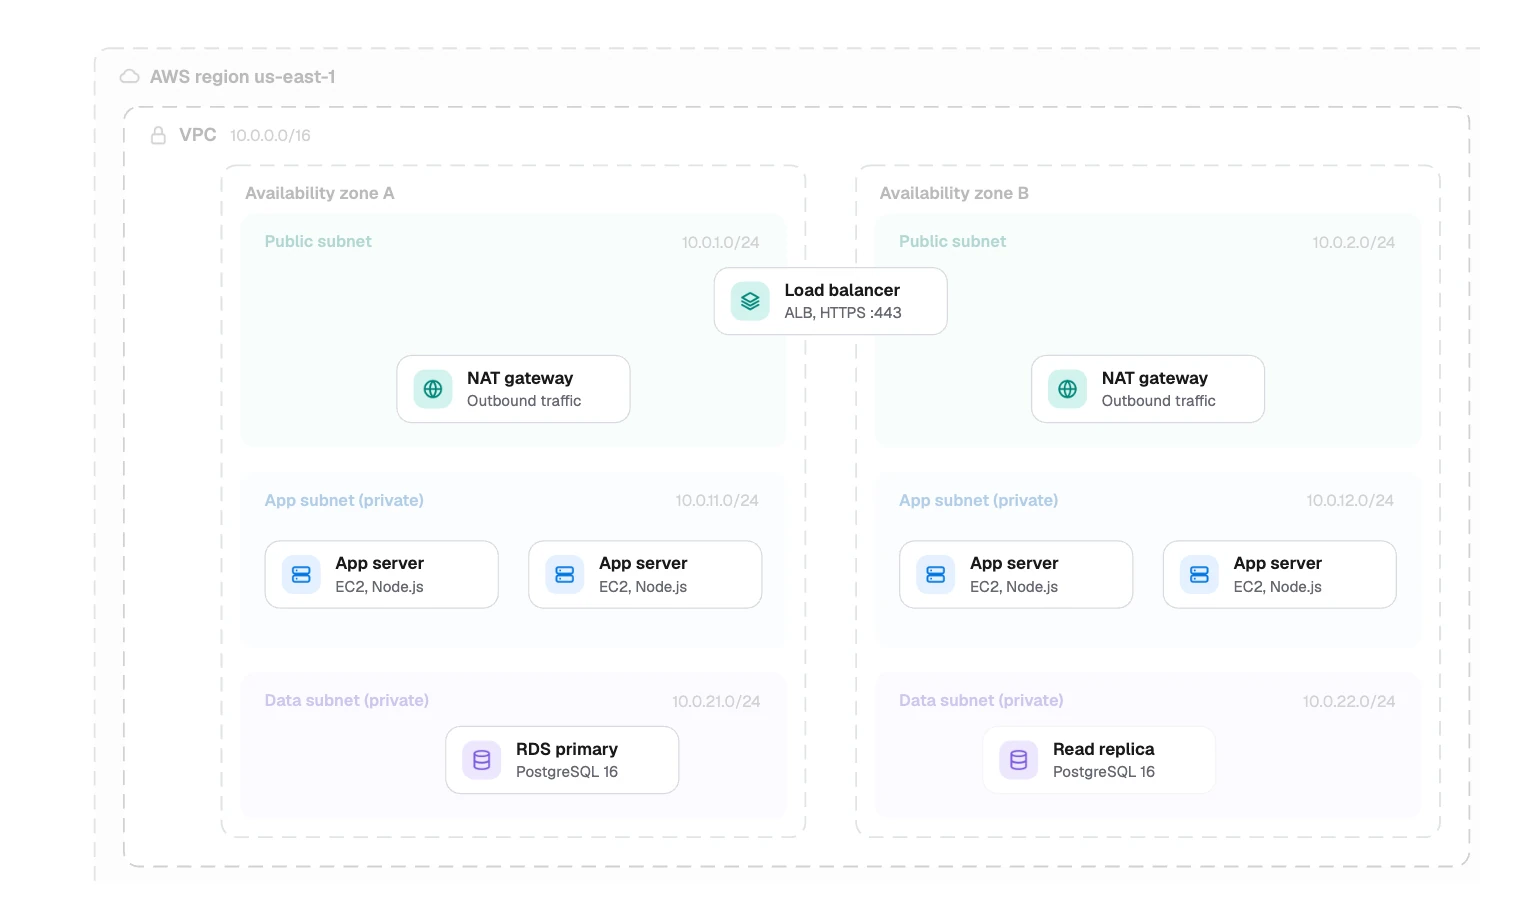
It is a map of a running system at the level of networks and managed services. Most diagrams stack the same layers, one inside the next:
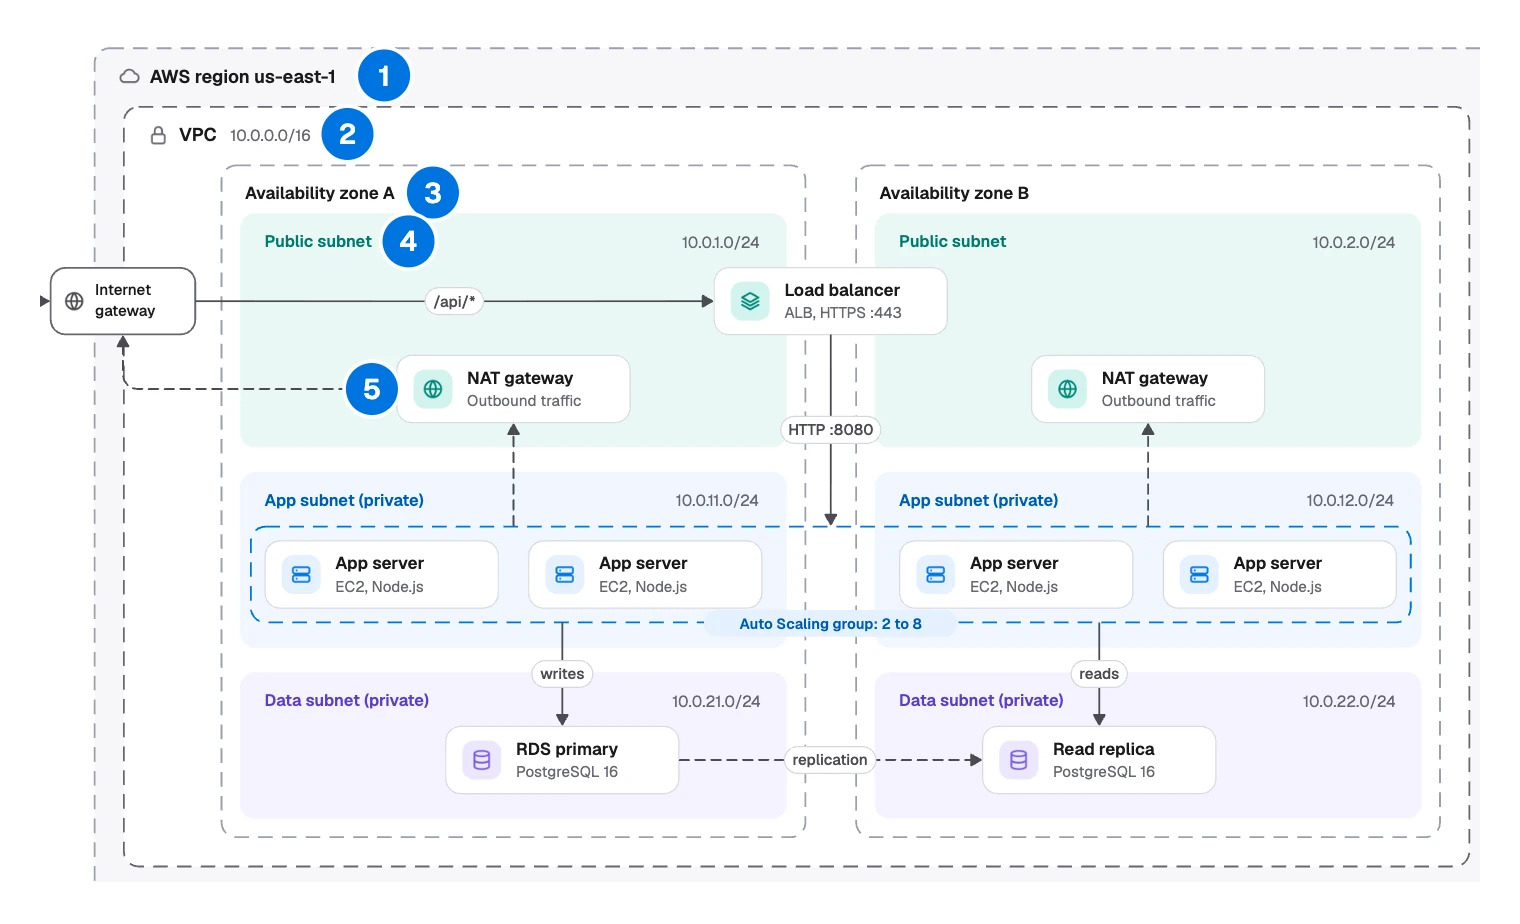
- Region: where the system lives. AWS region us-east-1.
- Network: the private address space. VPC, 10.0.0.0/16.
- Zones: what survives a data center failure. Availability zone A and B.
- Subnets: what the internet can reach. Public subnet, App subnet (private), Data subnet (private).
- Services: what runs where. NAT gateway, Load balancer, App server, RDS primary.
Three more things sit around that stack:
| Layer | What it tells the reader | In the example |
|---|---|---|
| Outside the region | How traffic arrives | Users, Route 53, CloudFront |
| Regional services | Managed services outside the network | CloudWatch, Secrets Manager, S3 bucket |
| Key | What each line style means | Request, Outbound, replica, Boundary |
Teams use one to review a design, check what is exposed to the internet, plan for a failure and bring new people up to speed.
To show what data moves and not where it runs, draw a data flow diagram. To follow one request step by step, use a sequence diagram.
Terms change between clouds: an AWS VPC is a virtual network on Azure. On AWS a subnet sits inside one zone, so this example nests subnets inside zones. On Azure and Google Cloud a subnet can span its region’s zones.
Walking through the three-tier example
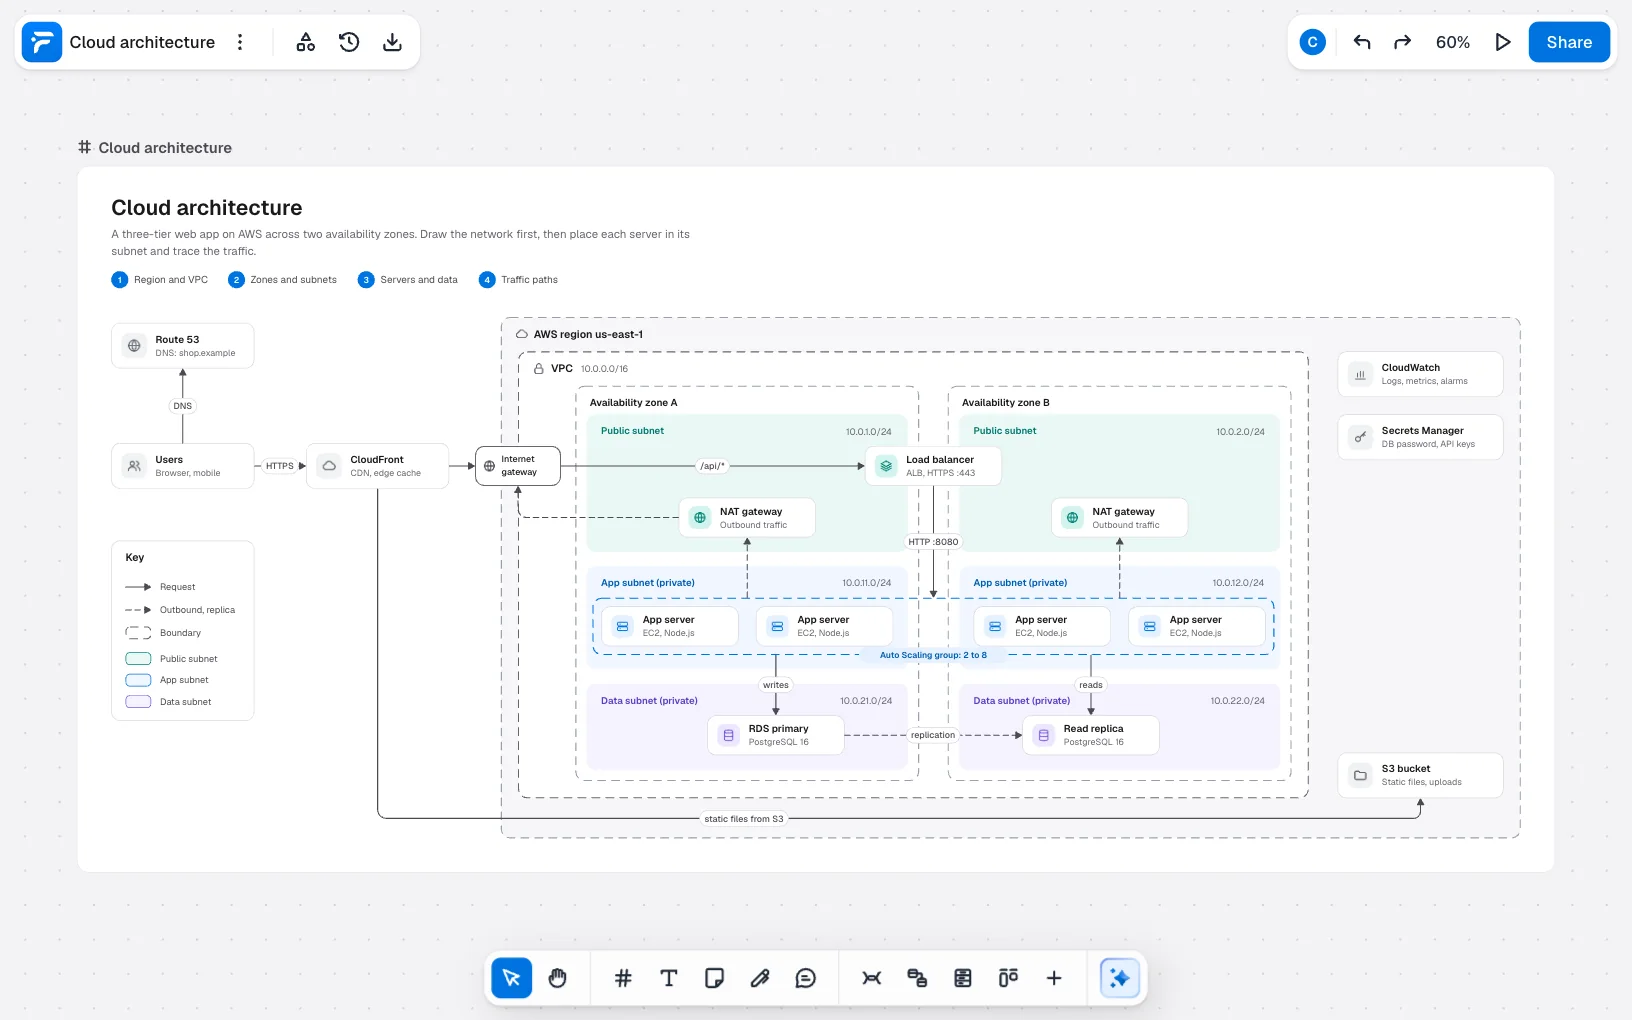
This is the sample in FlowDraw’s “Cloud architecture” template. Its names and address ranges are placeholders for a fictional shop, so swap in your own. Follow a request from the outside:
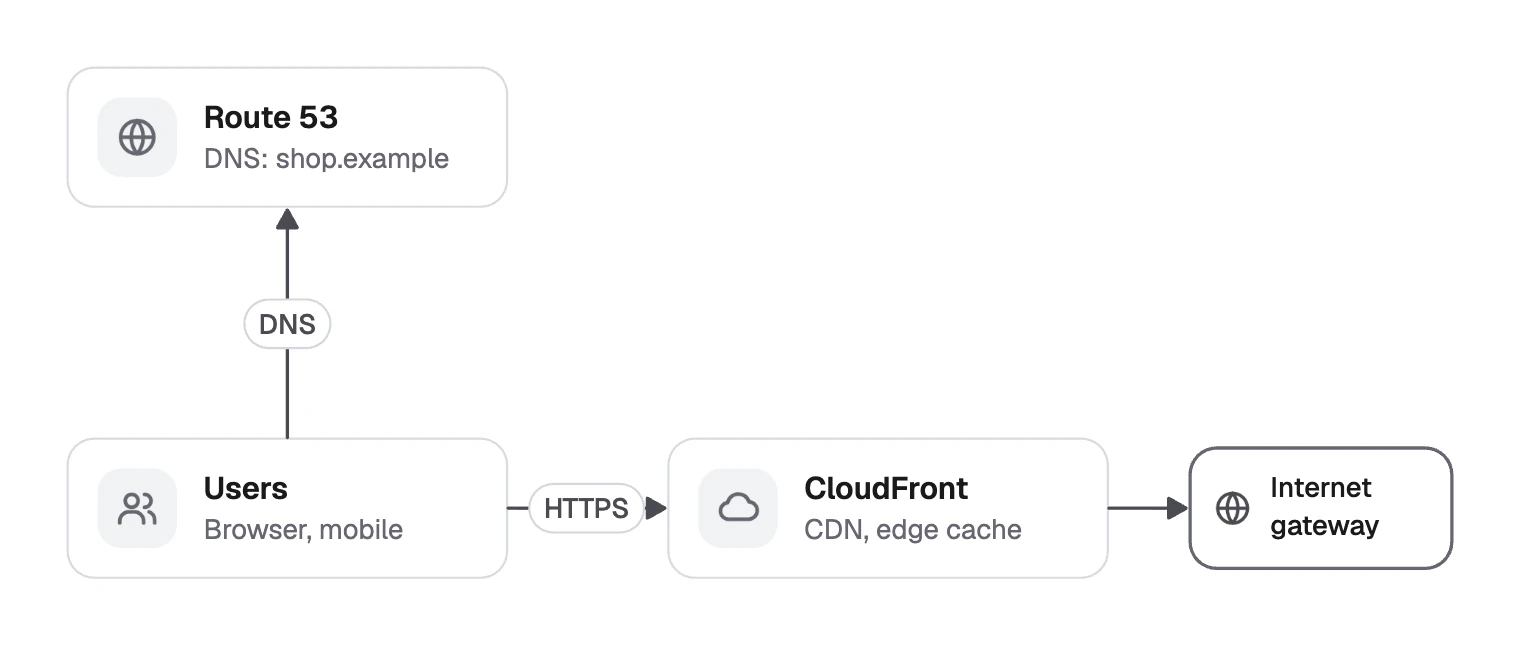
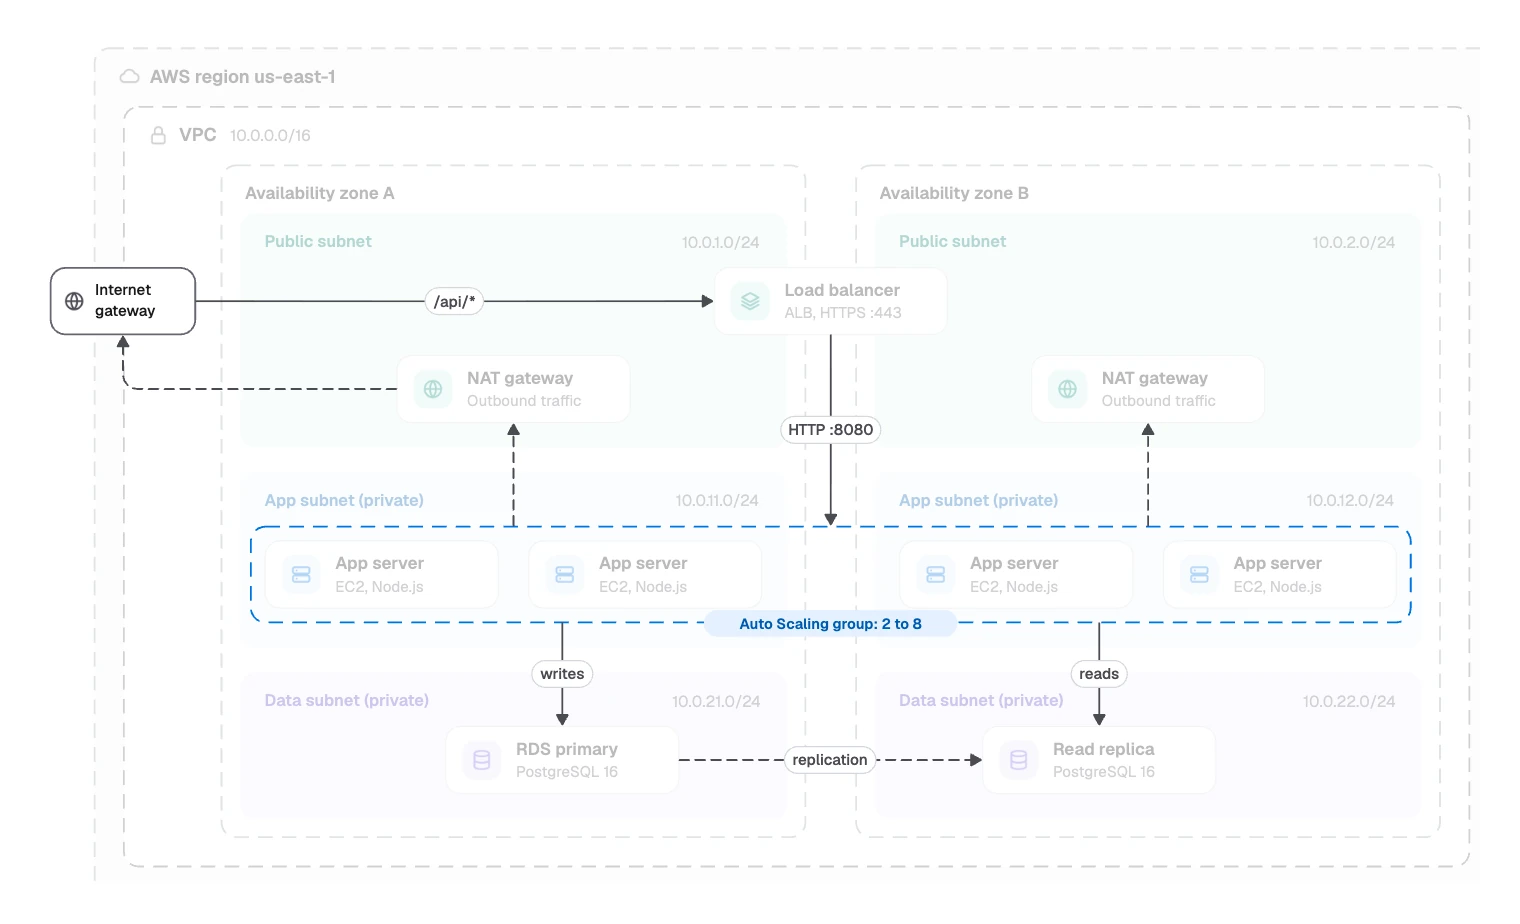
Users ask Route 53 for the address, then reach CloudFront over HTTPS. CloudFront serves static files from the S3 bucket and sends /api/* calls through the Internet gateway to the Load balancer.
That forwards to the App servers on HTTP :8080. They write to the RDS primary and read from the Read replica.
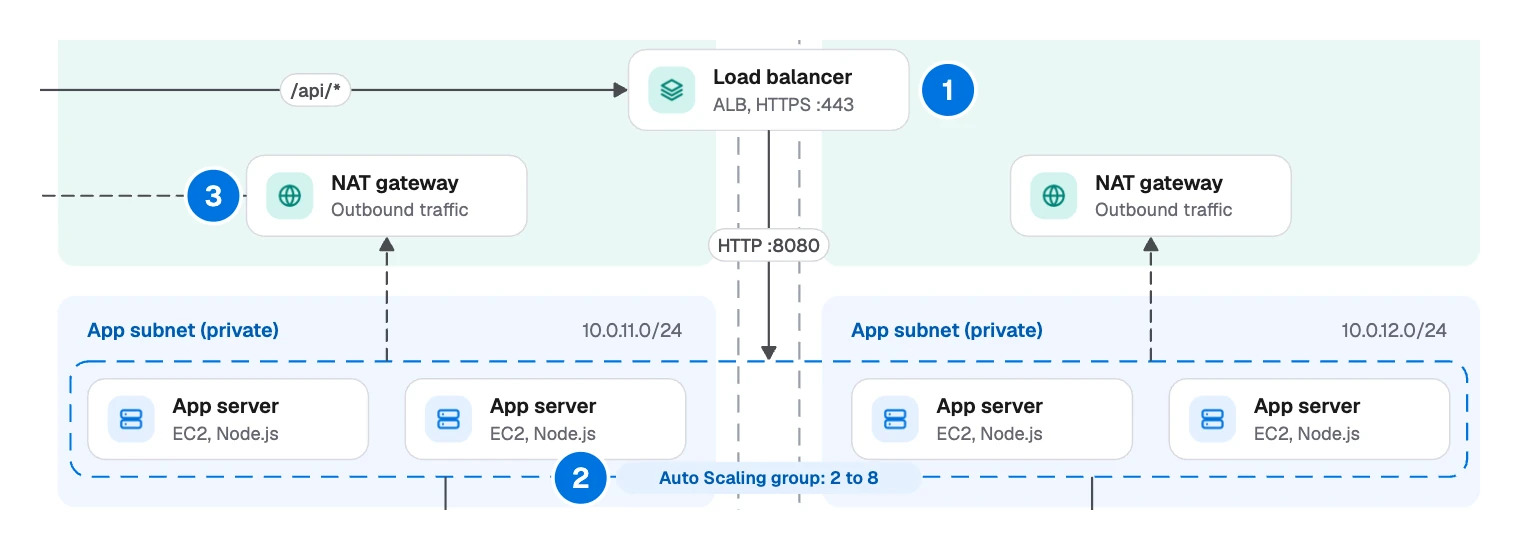
- The Load balancer sits across both zones, because an Application Load Balancer runs in more than one.
- One group wraps the App servers. The dashed box “Auto Scaling group: 2 to 8” says in one line what eight boxes would.
- Each zone has its own NAT gateway, so losing one does not cut the other’s access.
- Only the Load balancer reaches the App servers from outside. They sit in private subnets.
- Solid lines are requests, while outbound traffic and replication are dashed, as the key says.
- CloudWatch and Secrets Manager have no lines. So much talks to them that lines would add clutter.
- Each network shows its address range, so a reader can spot overlaps.
How to draw a cloud architecture diagram
The template’s own notes give the order: Region and VPC, Zones and subnets, Servers and data, Traffic paths. Add a question at the start and a test at the end.
- Choose the question. A security review and an onboarding talk need different diagrams. Put it in the title, and say if this is a proposal. For more views, think in zoom levels.
- Draw the boundaries from the outside in. Region, network, zones, then subnets.
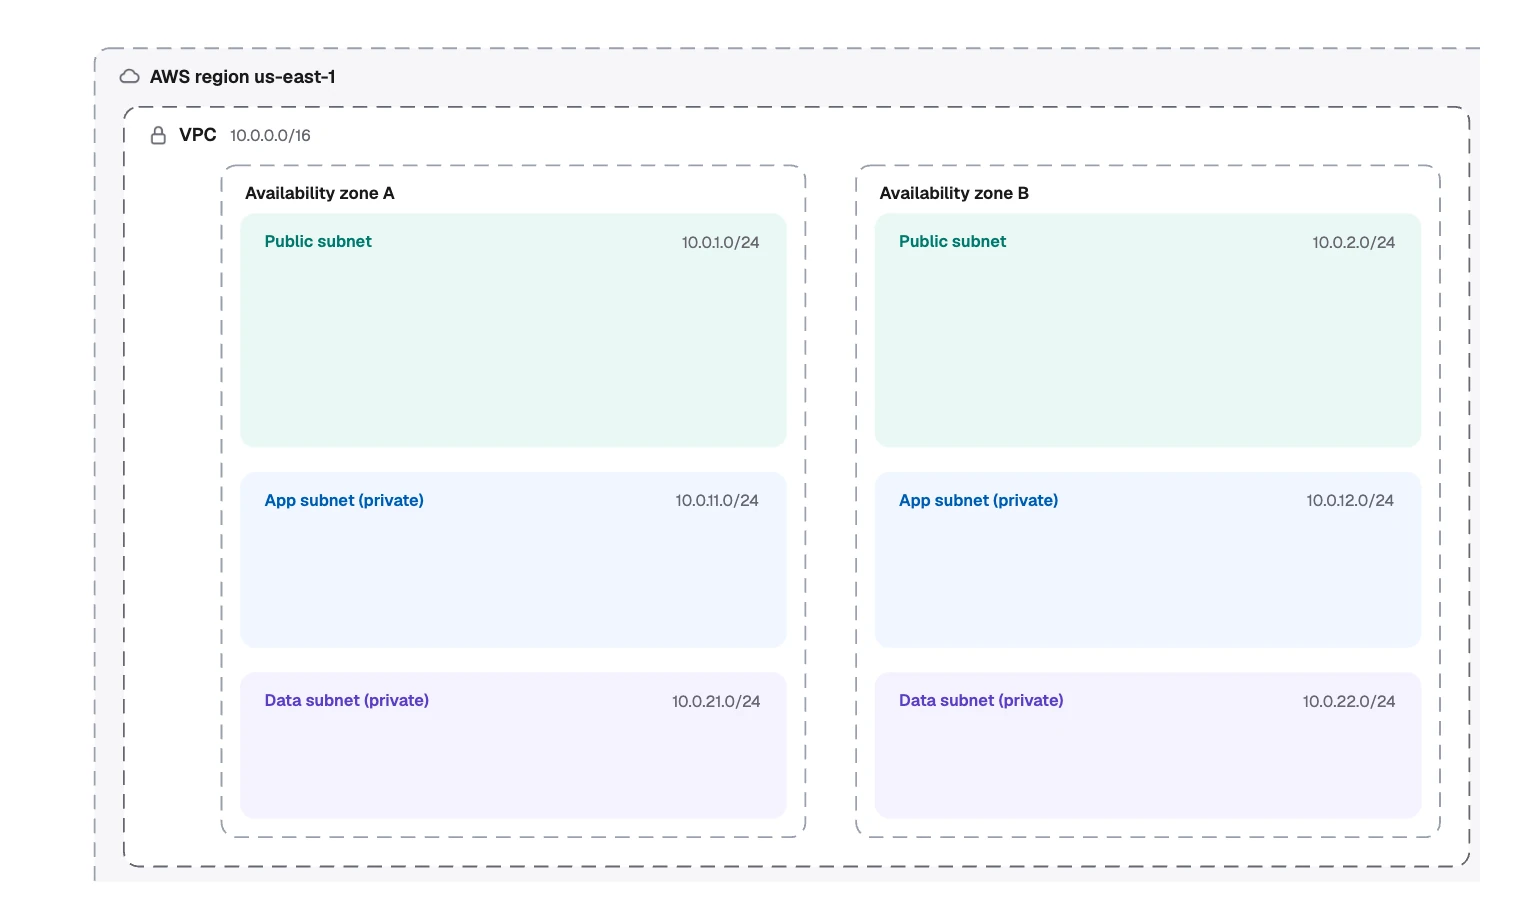
- Place each service inside its boundary. Give it a name and one useful detail, such as “EC2, Node.js”.
- Trace the main request path. Use solid arrows and label each with what travels on it: a protocol, a port or a path.
- Add the secondary paths. Outbound traffic, replication and backups go on as dashed lines.
- Add a key. Explain each line style and color.
- Test it with failure questions. If zone A goes down, what stops? What can reach the database? Where do the secrets live?
Drawing it in FlowDraw
It is not a Pro template, and the small pictures in it are ordinary images, so it works on every plan.
Open the template
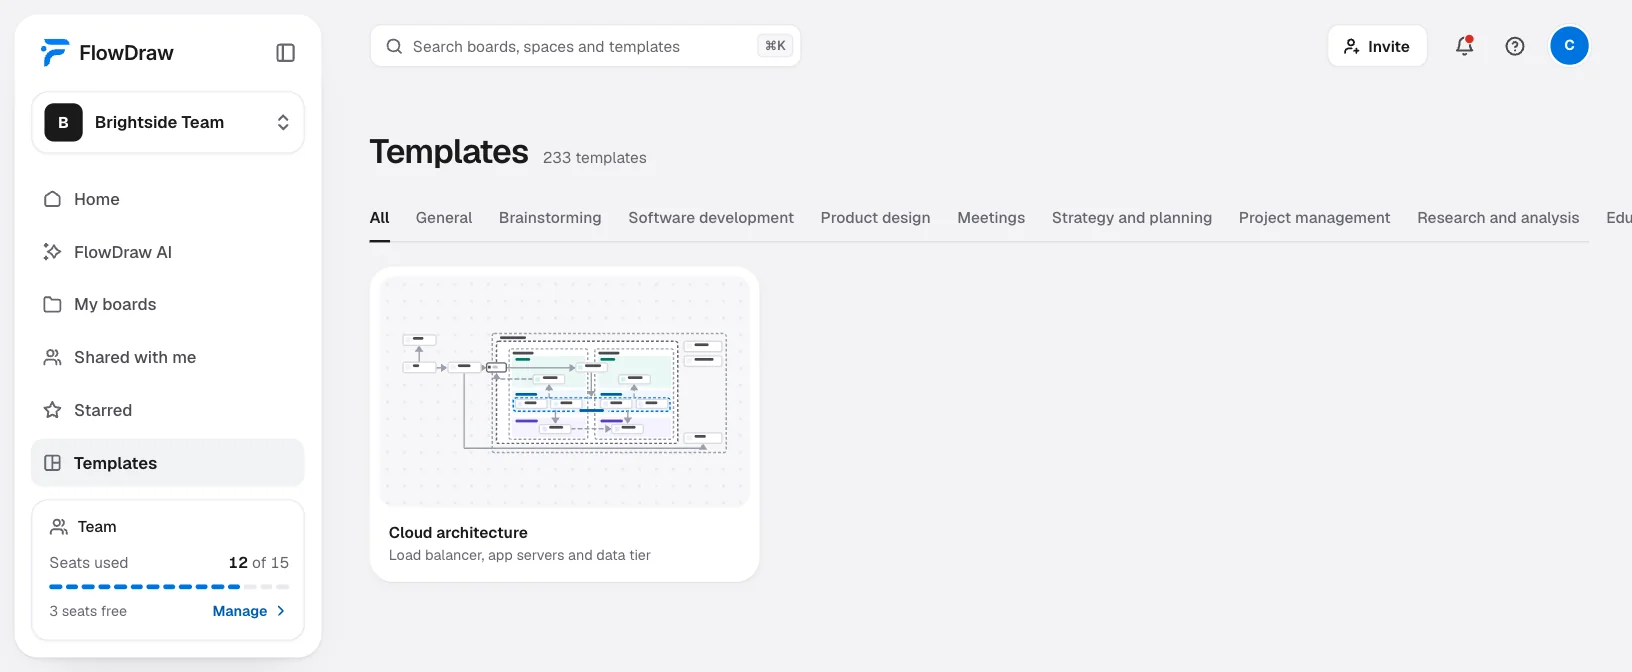
“Cloud architecture” is under “Templates” in the sidebar, in “Software development”. Open its preview and choose “Use template”.
Rename the services
Each service is a box, an icon tile, a picture and two text boxes. Double-click the text to change it. To move one, Shift-click its parts and press ⌘G (Ctrl+G on Windows).
Resize the boundaries
They are ordinary rounded rectangles. Drag their handles, and use “Shape properties” for the line style or fill.
Redraw the traffic
Connectors stay attached and find a new route after a move. “Line properties” sets “Elbow”, “Dashed” and “Add a label”.
Add vendor icons if you want them
“Shape library” has the official AWS (810 icons), Azure (714) and Google Cloud (45) sets, each icon named. All three are Pro.
Export or embed it
Choose “Export”, pick “PDF” or “PNG”, and set “Page” to the frame. For your docs, use “Share”, the “Embed” tab and “Copy code”. An embed opens without an account and is read-only.
The Free plan has one catch. The template uses 146 of a Free board’s 150 elements, and one service box alone is five. Deleting the title block and key frees 24 more, and a larger system needs a simpler drawing or Pro.
Without the template, open a “Blank board” from Home and press F for a frame. Draw boundaries with “Rounded rectangle” from “Basic shapes”, with a dashed stroke. “Cloud” and “Cylinder” there are free stand-ins for vendor icons, as long as you write the names.
“System architecture”, “Network topology” and “C4 container diagram” are other free starting points.
Common cloud diagram mistakes
| Mistake | Why it hurts |
|---|---|
| Icons with no names | Few people know every icon, so write the service name |
| Everything on one diagram | Network, pipeline and app logic each need their own view |
| Missing boundaries | Nobody can tell what is exposed to the internet |
| A proposal that looks like today’s system | Readers assume it is true now unless the title says not |
| A read replica drawn as failover | A replica serves reads, so draw any standby as well |
| Showing only inbound traffic | Outbound calls and backups matter when something breaks |
| Real secrets on a shared board | Name where secrets live, and never write the values |
FAQ
The boundaries, such as region, network, zones and subnets. The services inside them, each with a name and one useful detail. Labeled lines for the main traffic. And a key that explains your line styles.