
How to make a user journey map
Learn how to make a user journey map: choose a persona, set the stages, track actions and emotions, find pain points and build one in FlowDraw.
Sam is trying a bike share for the first time, on the way from the train to a downtown office. The ride goes well, then every dock near the office is full. A user journey map is how you find moments like that.
Quick AnswerA user journey map follows one person through one experience, stage by stage. For each stage it records what they do, where it happens, what they think and how they feel, then marks pain points and opportunities. Base it on research, and keep each map to one persona and one scenario.
What is a user journey map?
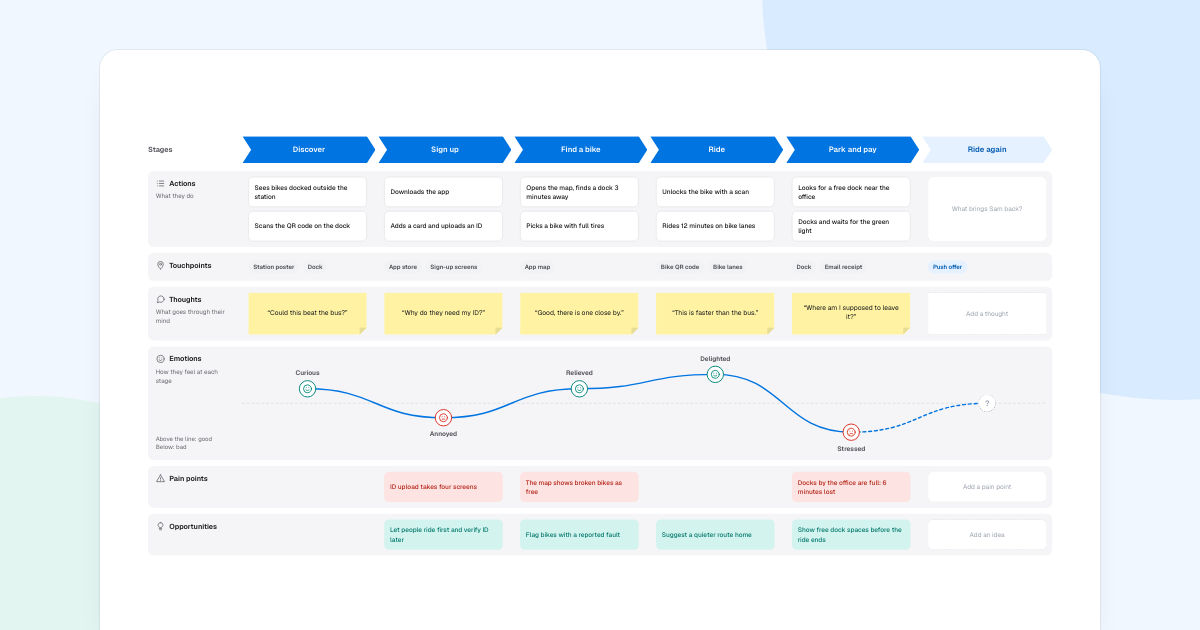
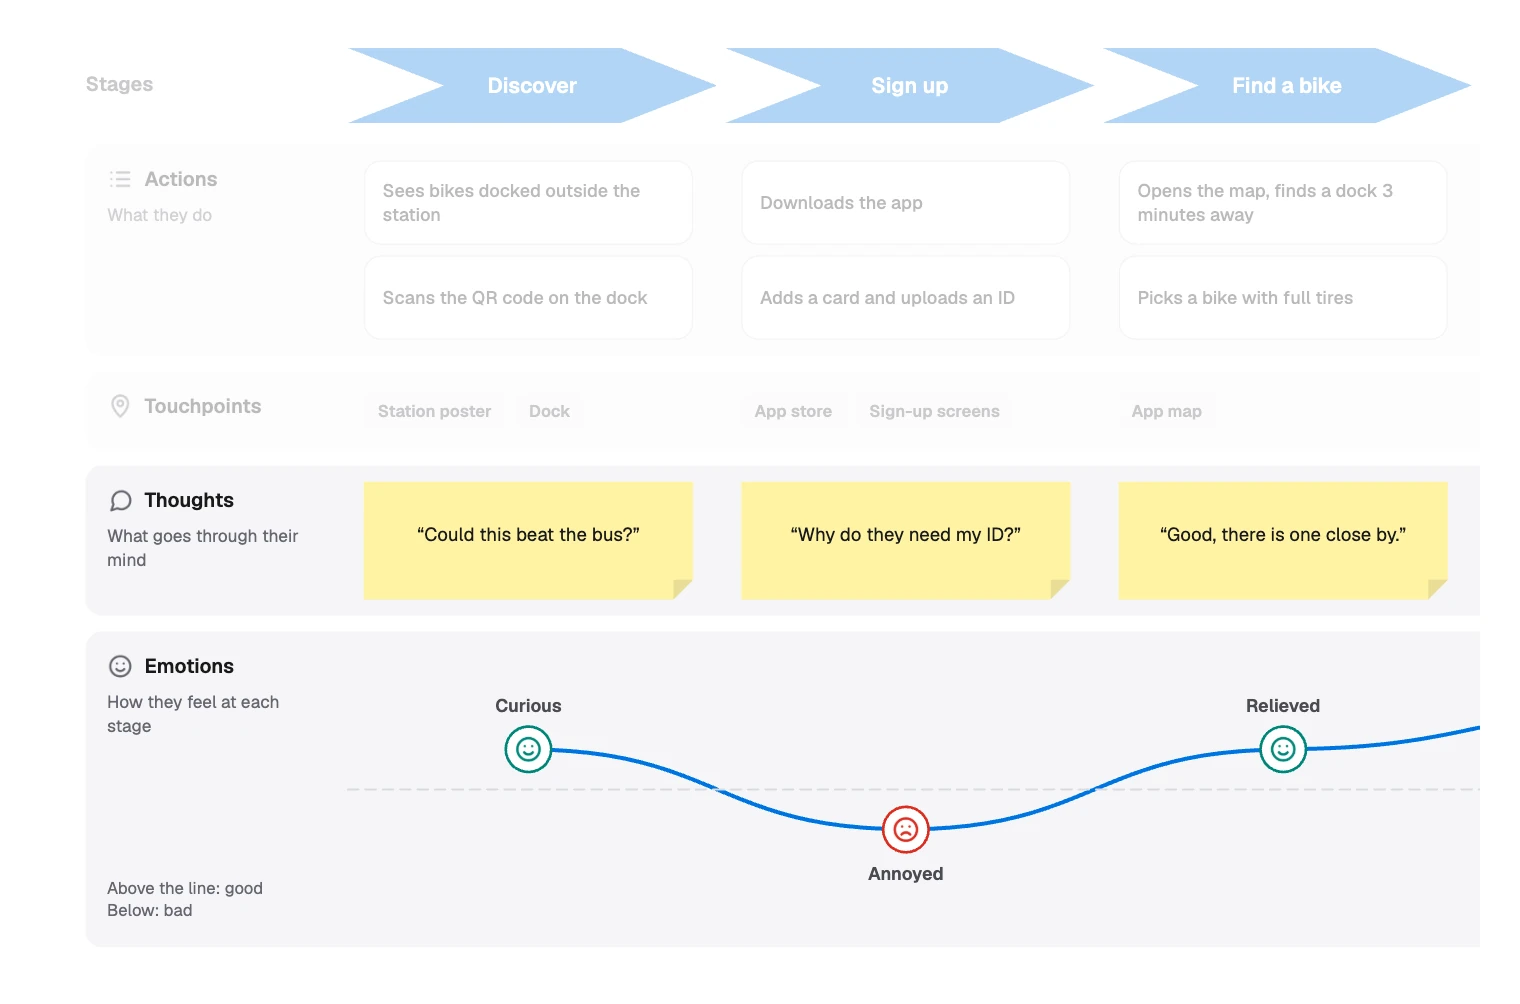
It shows an experience from the person’s side. Here is Sam’s mood, above what went wrong:
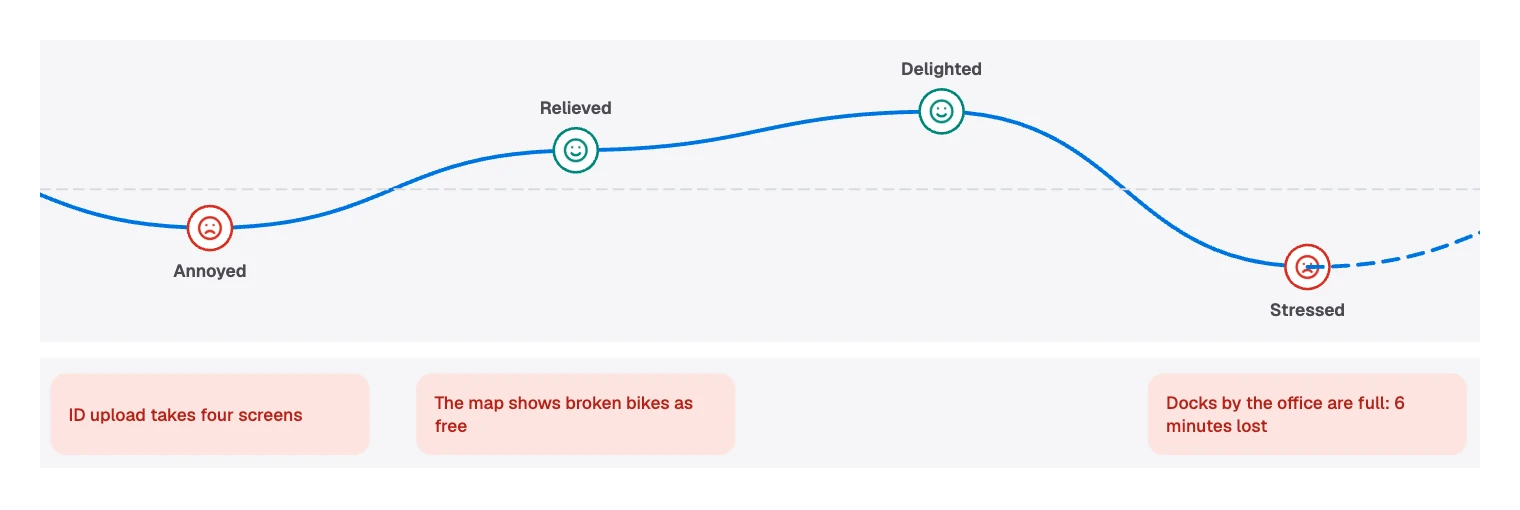
Product teams use one to agree on where things break and what to fix first. It works best on an experience that already exists, so you can watch real people.
Several diagrams sound similar, and each answers a different question:
| Diagram | Question it answers | FlowDraw template |
|---|---|---|
| User journey map | What is this like for the person? | “User journey map” |
| User flow | Which screens and choices does a task take? | “User flow” |
| Service blueprint | What has to happen behind the scenes at each step? | “Service blueprint” |
| Empathy map | What does this person say, think, do and feel overall? | “Empathy map” |
| Swimlane diagram | Who does which step? | “Swimlane” |
What goes in each row
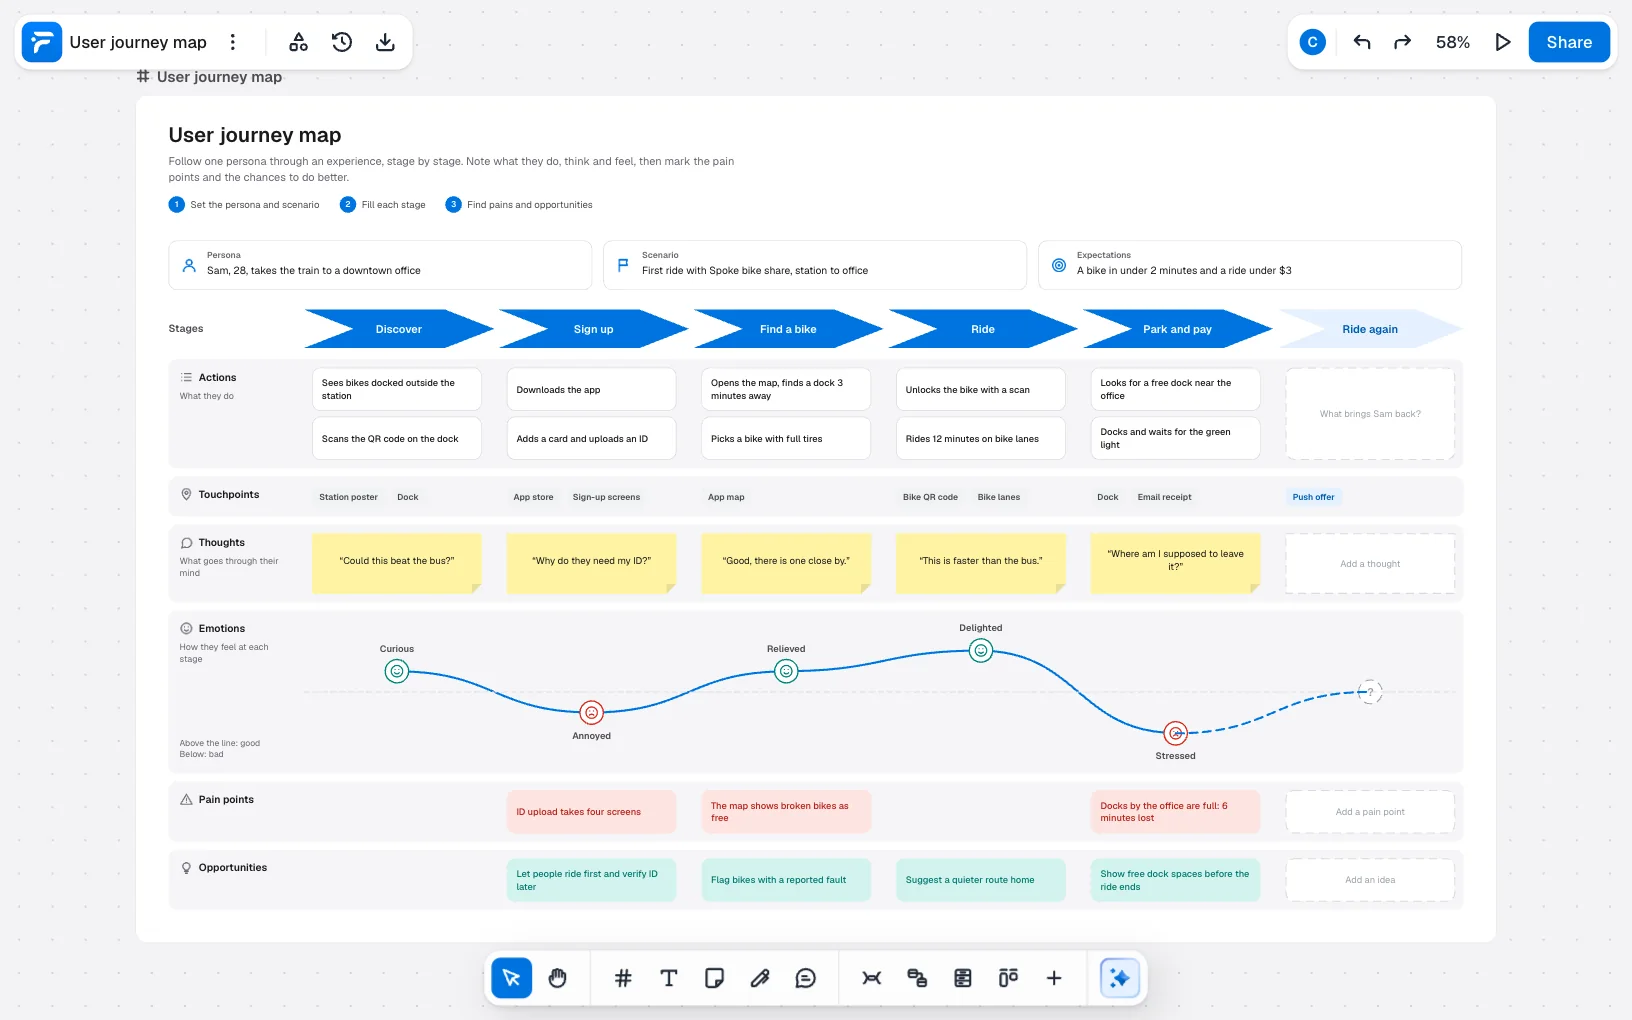
Sam is the sample persona in FlowDraw’s “User journey map” template, and Spoke is its made-up bike share. Three lines at the top set the scene:
- Persona: Sam, 28, takes the train to a downtown office
- Scenario: First ride with Spoke bike share, station to office
- Expectations: A bike in under 2 minutes and a ride under $3
Below that, stages run across the page and rows run down it.
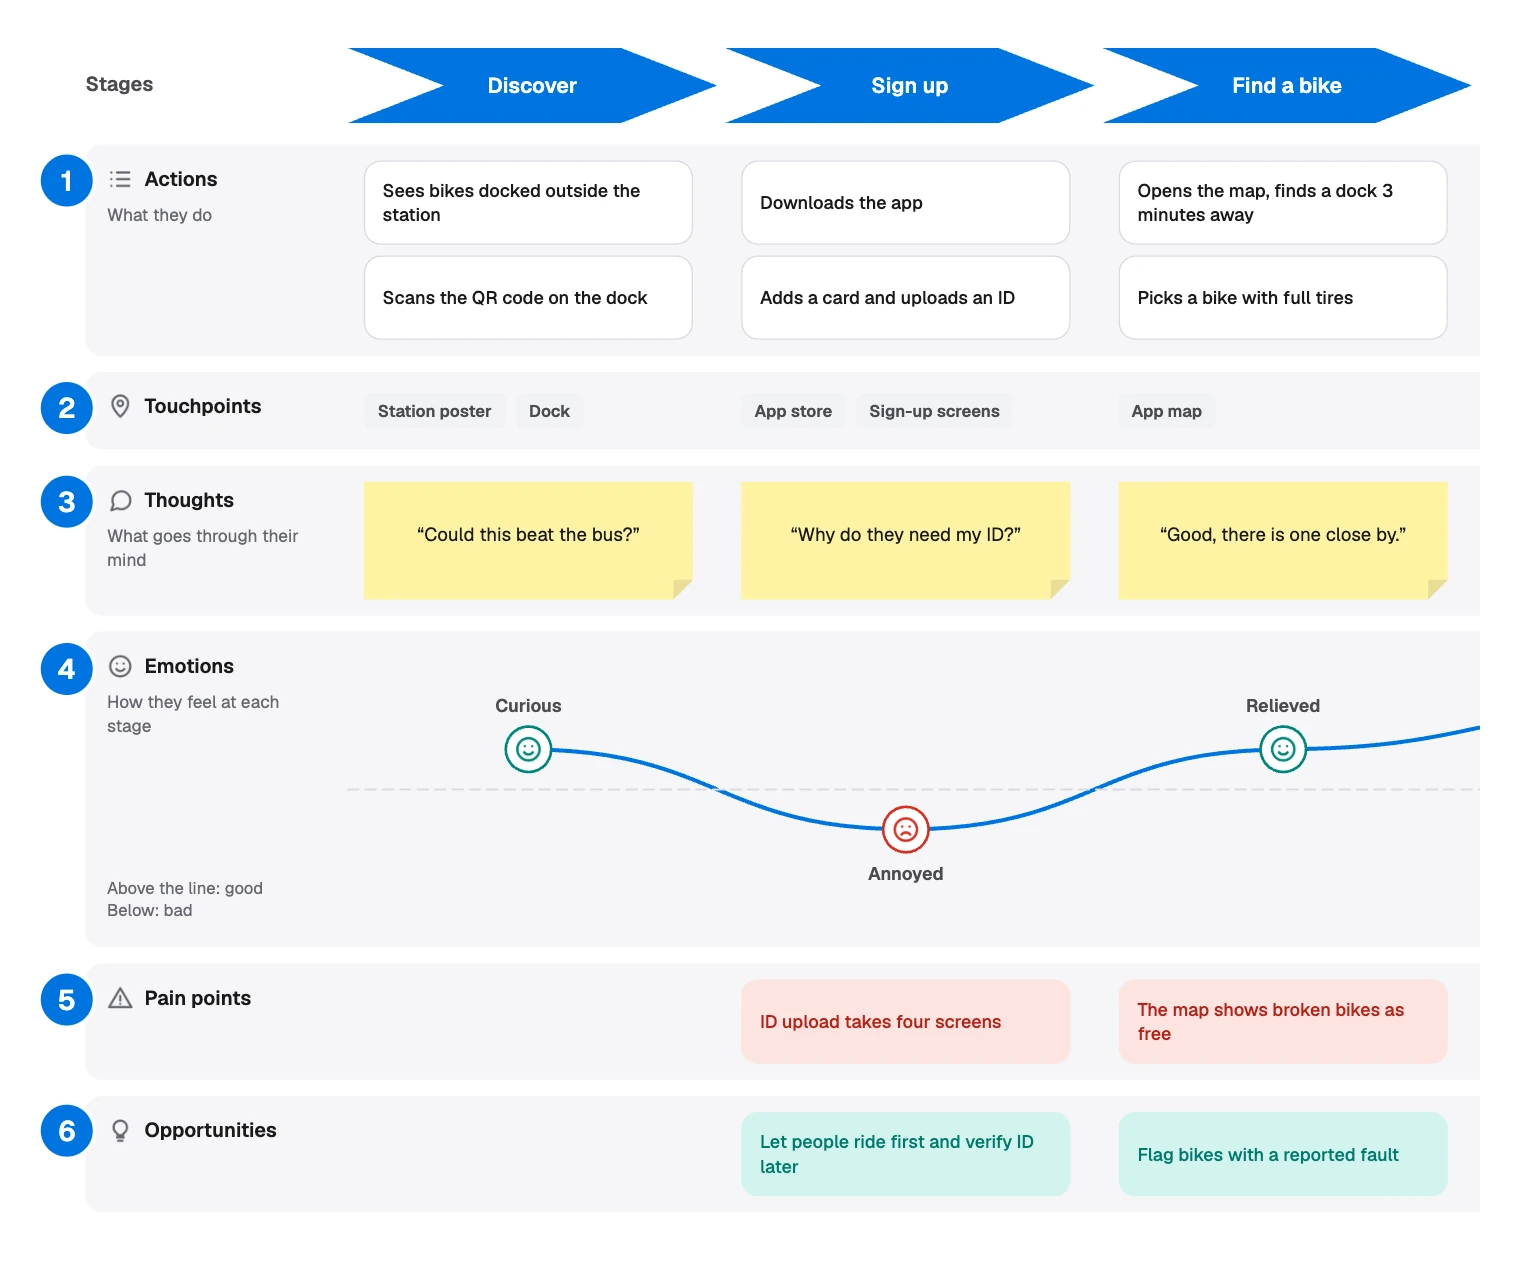
Reading one column shows how the rows work together. Each example here comes from a later stage, Park and pay:
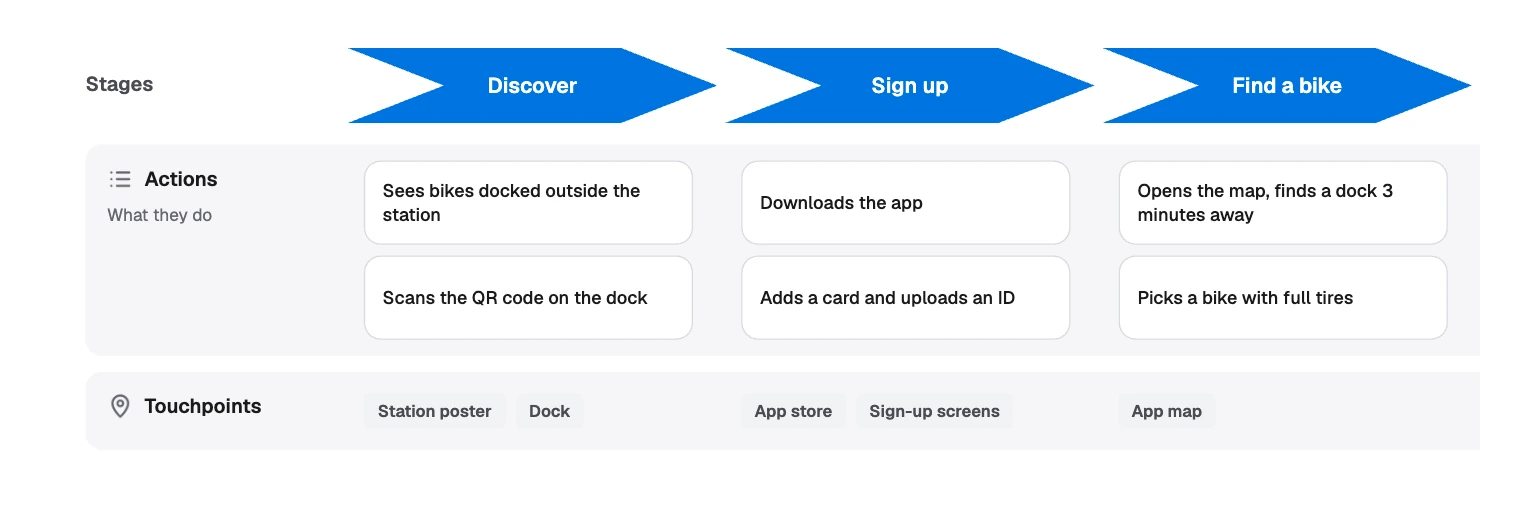
- Actions: what they do. Looks for a free dock near the office.
- Touchpoints: where it happens. Dock, Email receipt.
- Thoughts: what goes through their mind. “Where am I supposed to leave it?”
- Emotions: how they feel. Stressed.
- Pain points: what goes wrong. Docks by the office are full: 6 minutes lost.
- Opportunities: what you could do about it. Show free dock spaces before the ride ends.
Why the bike share map is laid out this way
Columns are moments and rows are lenses, so a pain point sits directly above its opportunity and the fix stays tied to its moment.
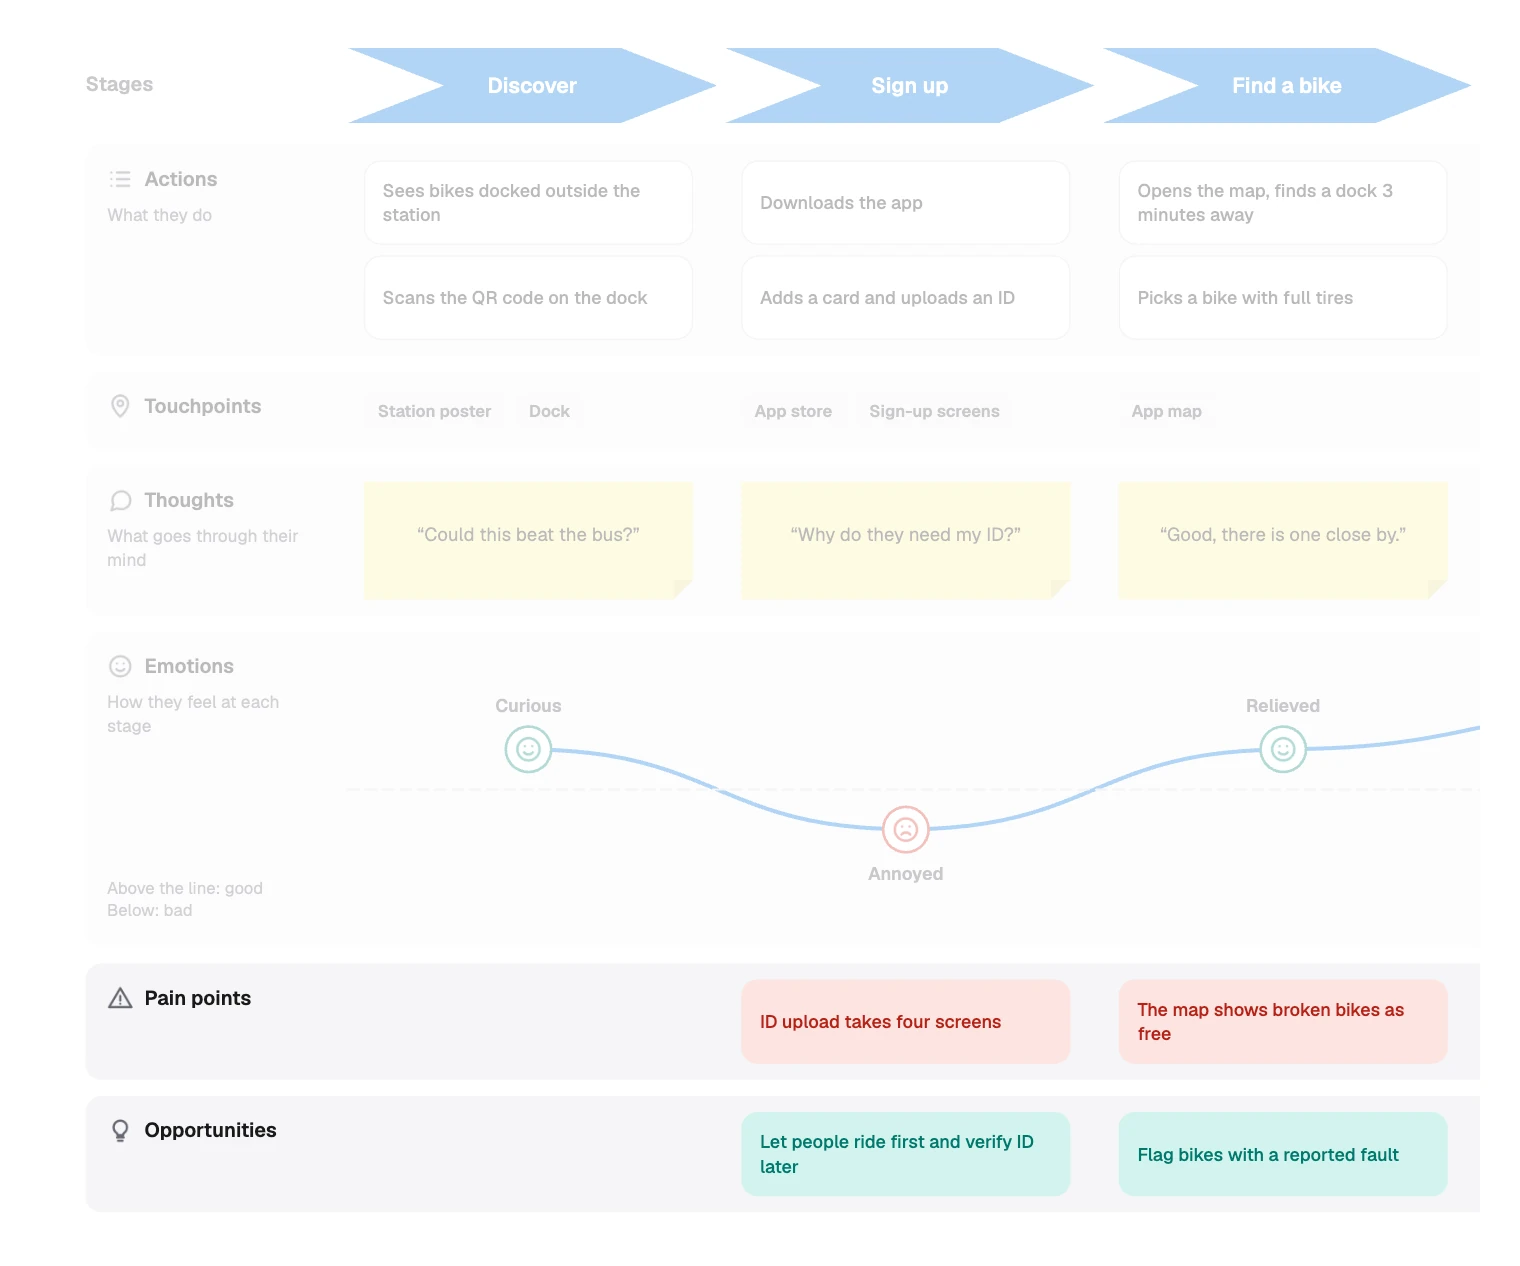
- Expectations set the yardstick. Sam expected a bike in under 2 minutes, which is why 6 minutes lost at the dock is worth marking.
- The curve has to agree with the rows. The two lows fall on “ID upload takes four screens” and the full docks. A dip with no pain point means you missed something.
- The reverse can happen too. “The map shows broken bikes as free” sits under Relieved, because Sam still found a good bike.
- Not every column needs a pain point. Ride has none, and still has an opportunity: “Suggest a quieter route home”.
- The last stage is left open. Ride again holds only prompts such as “What brings Sam back?” That marks what you do not know yet.
How to make a user journey map
- Pick one persona and one scenario. Write what they are trying to do and what they expect. A second persona gets a second map.
- Gather evidence. Interviews, support tickets, analytics and watching people all count. Keep their actual words for the Thoughts row.
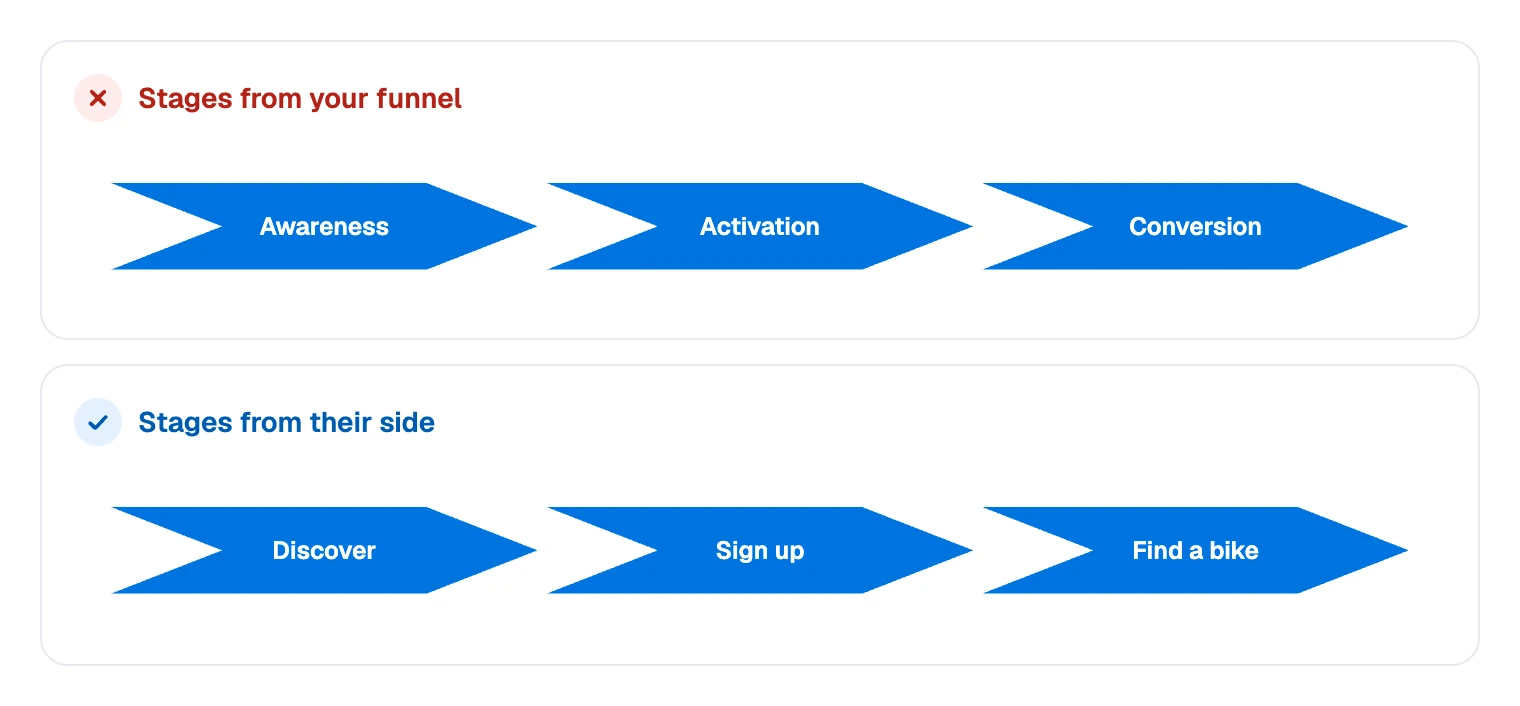
- Set the stages from their side. “Find a bike” is something Sam would say. “Activation” is something your funnel would say.
- Fill in actions and touchpoints first. These are facts, and they are the easiest to check.
- Add thoughts and emotions. Tie each to something you saw or heard. Mark guesses as guesses.
- Mark the pain points. Say what went wrong and what it cost, as “6 minutes lost” does.
- Turn them into opportunities. Choose a few for the worst moments and give each an owner. A kanban board can track them.
- Check it with people who were there. Researchers and support staff will spot what does not ring true.
Building a journey map in FlowDraw
The template is free on every plan, but at 108 elements it takes up most of a Free board’s 150, so add with care.
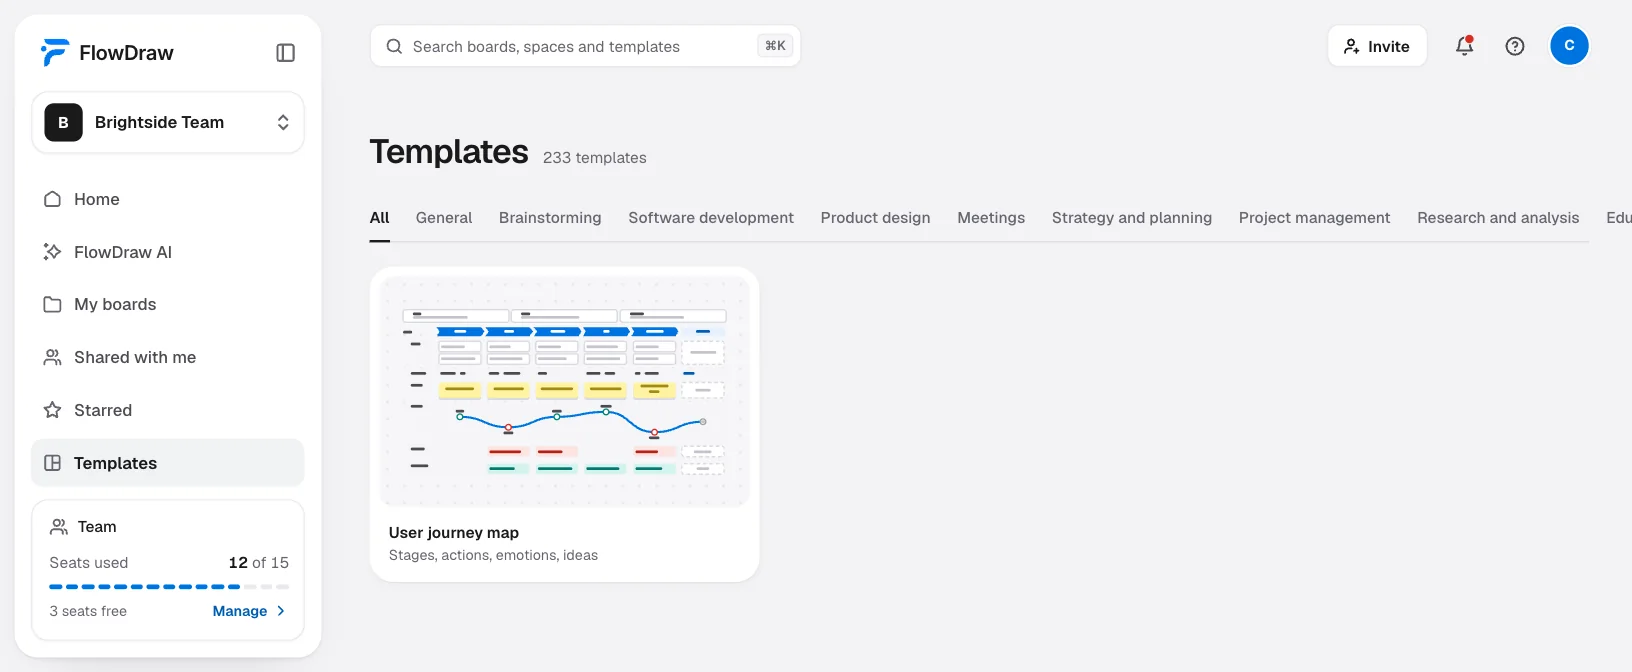
Open the template
“Templates” in the sidebar lists it under “Product design”. Search for “User journey map”, open the preview and choose “Use template”.
Set the scene
Double-click the text under “Persona”, “Scenario” and “Expectations”, and type your own.
Name your stages
The arrows across the top are “Chevron” shapes. Double-click one to rename it. To add a stage, Shift-click the parts of a column, press ⌘D (Ctrl+D on Windows) and drag the copy across.
Fill in the rows
Actions are rounded boxes, and Thoughts are sticky notes. With nothing selected, press N and pick a color to add a note.
Redraw the emotion curve
Four “Pen” strokes and one “Curved” line join the faces, and they do not follow a moved face. With nothing selected, draw with P, or press L and join two faces with “Curved” so the line moves too.
Review it together
Choose “Share” and give people “Can comment”. They can press C and click any stage to add a question. “Present” fills the screen with the map for a walkthrough.
To build it from nothing, use “Blank board” on Home. Take “Chevron” and “Rounded rectangle” from “Basic shapes”, add sticky notes with N and draw the curve with P.
For a fast first draft, “More tools” › “Table” gives you a grid, and a whole table counts as one element on Free.
Journey map mistakes to avoid
Mapping “the user”. An average person has no real expectations and no real bad day. Choose someone specific.
Assumptions dressed as findings. A clean map looks like research, even after one meeting. Say which parts you have seen.
Stages named after your funnel. They describe what you want from the person and hide what the person is doing.
Every click on the map. Recording screens calls for a user flow. Keep this at the level of what Sam would tell a friend.
An emotion curve with no evidence. Each point should trace back to something someone said or did.
Stopping at the pain points. Problems with no owners change nothing. When you ship a fix, see whether the low point has moved.
FAQ
A user flow shows the screens and choices a task takes, as a map of the product. A journey map shows what the experience is like for the person, including what they think and feel, and what happens away from the screen.