
How to do a SWOT analysis
How to do a SWOT analysis that ends in decisions: what belongs in each quadrant, how to pair factors into moves, and how to run one in FlowDraw.
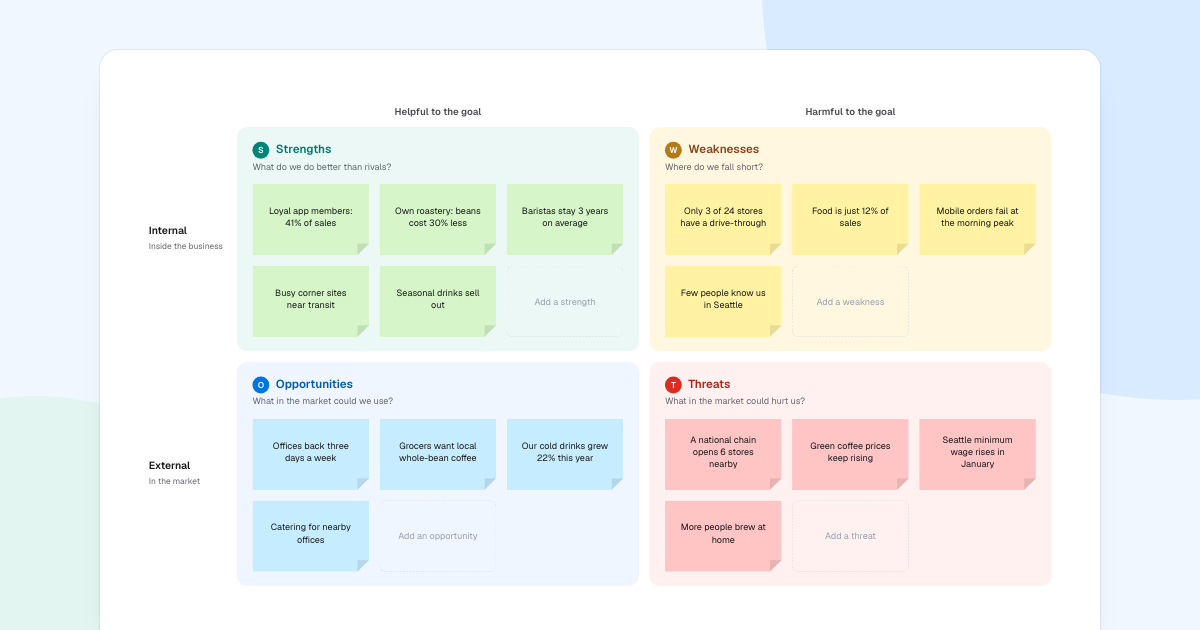
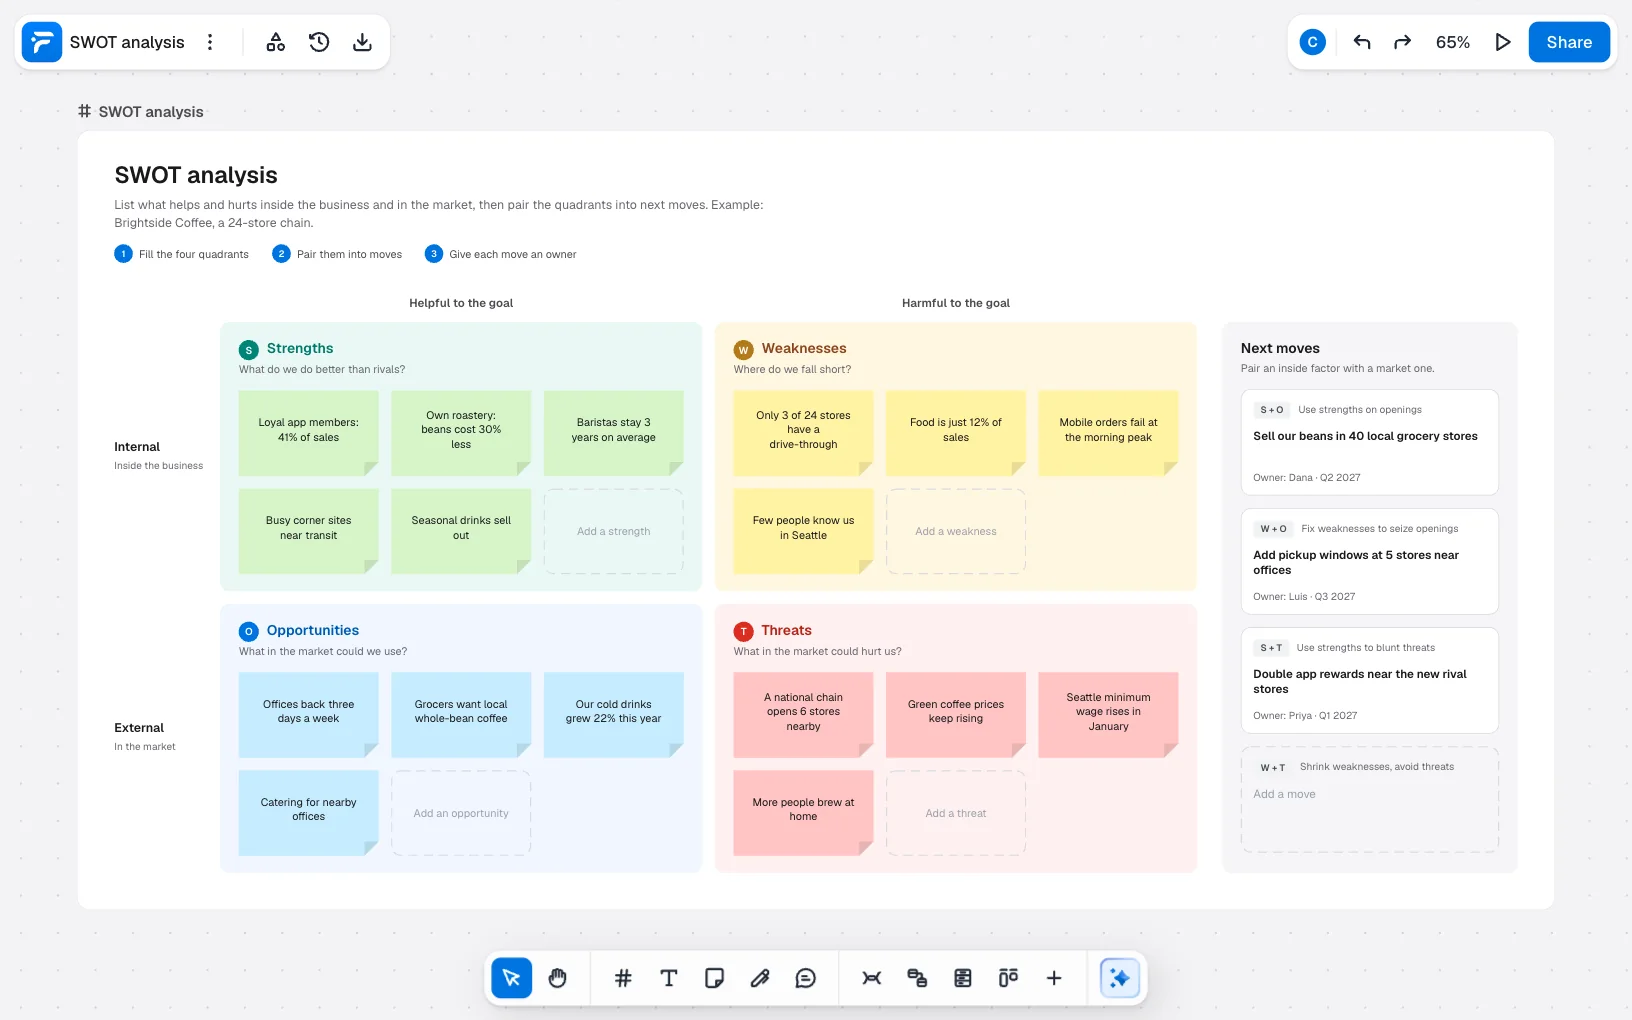
A SWOT analysis is easy to fill in and easy to waste. Many end with four tidy lists and no decision. This guide shows how to do a SWOT analysis that ends in action, using Brightside Coffee, a made-up 24-store chain in FlowDraw’s template.
Quick AnswerA SWOT analysis lists strengths and weaknesses inside a business, and opportunities and threats in its market, all measured against one goal. To do one, gather evidence, fill the four quadrants, pair inside factors with market ones, and give each resulting move an owner and a date.
What is a SWOT analysis?
SWOT stands for strengths, weaknesses, opportunities and threats. The two questions behind its grid do most of the work:
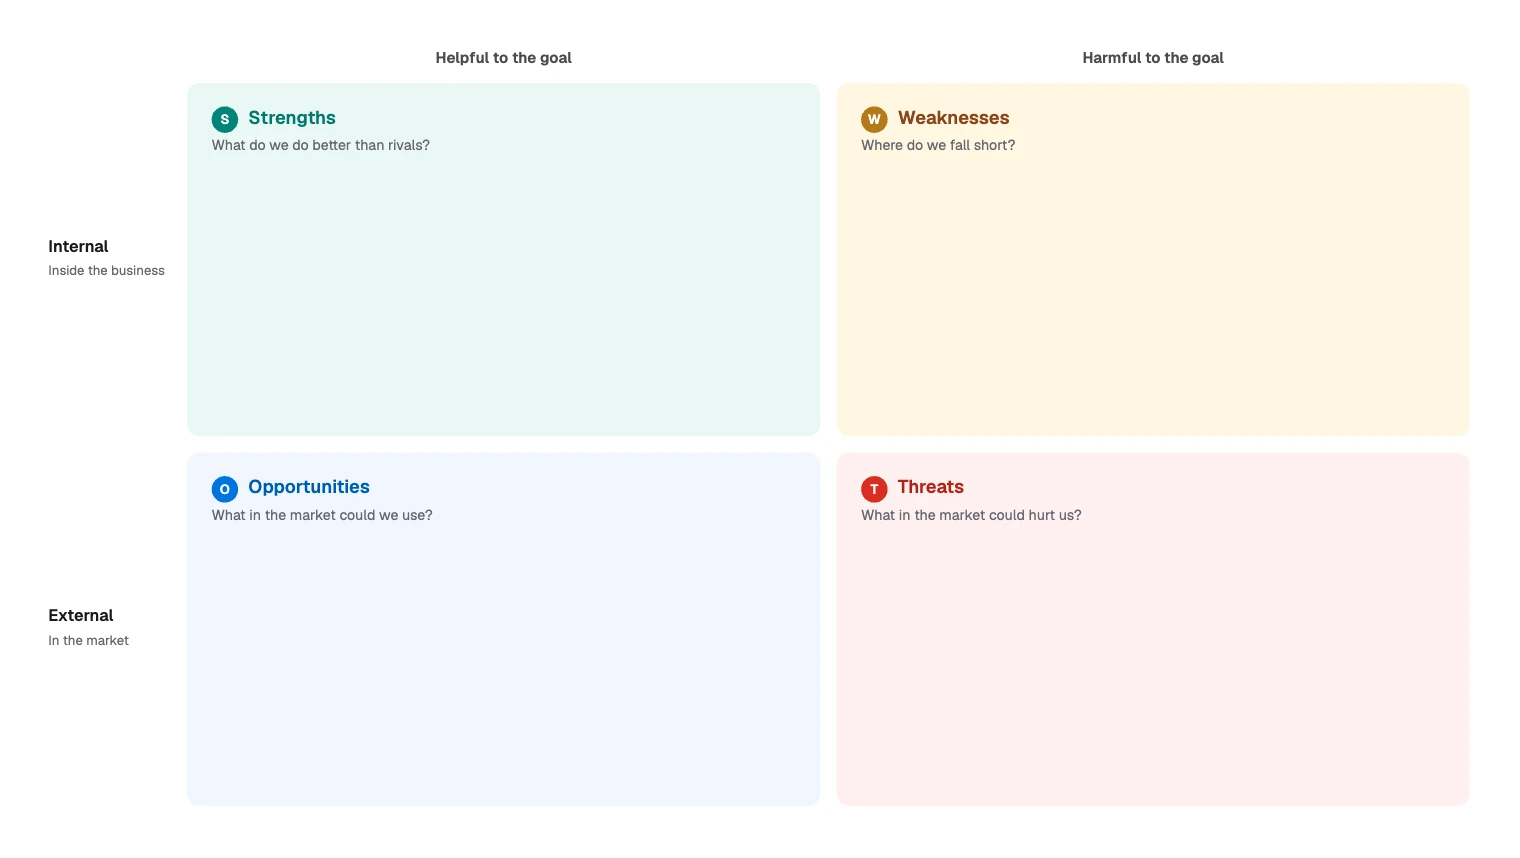
There is a simple test for the rows. Would this still be true if your company did not exist? If so, it is external.
“Seattle minimum wage rises in January” would still happen without Brightside. “Own roastery: beans cost 30% less” would not.
Use a SWOT before setting a plan, entering a market or launching something. It is a broad view, so other tools suit narrower questions:
- One specific problem: a fishbone diagram.
- Known options, with numbers: a decision tree.
- Outside forces in more depth: FlowDraw’s “PESTLE analysis” and “Porter’s five forces” templates.
How to do a SWOT analysis
- Write down the goal. The columns mean nothing without one. “Open in a new city” gives a different SWOT from “Grow profit in the stores we have”.
- Gather evidence first. Sales figures, customer feedback and rivals’ prices all help, because a note with a number can be checked.
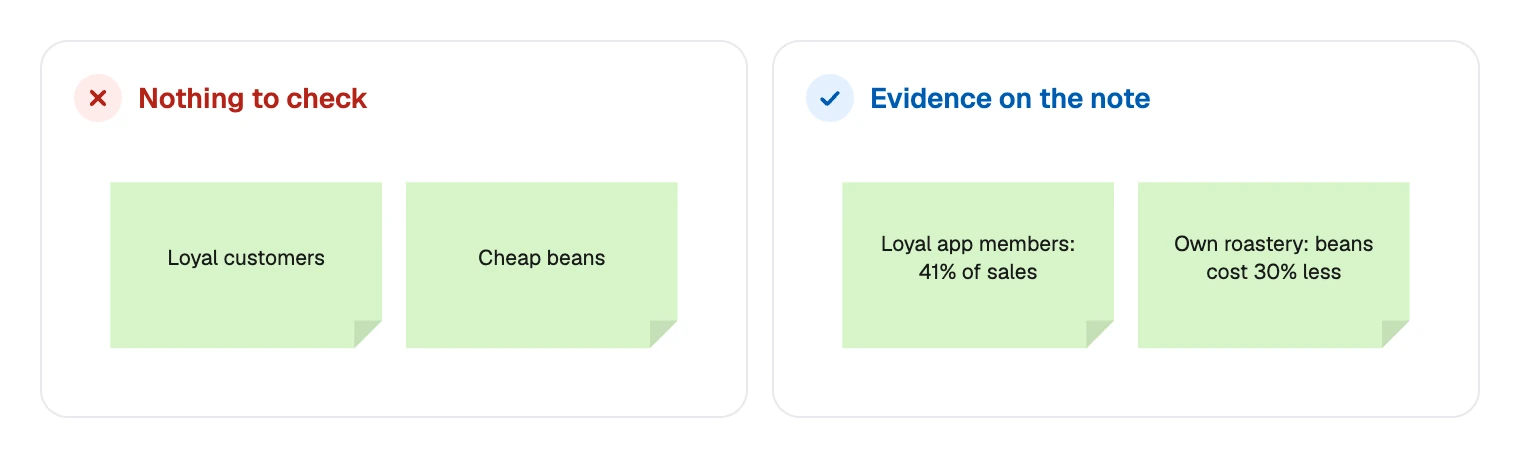
- Fill in the inside quadrants. The template asks what you do better than rivals and where you fall short. Compare yourself with rivals, not with your own hopes.
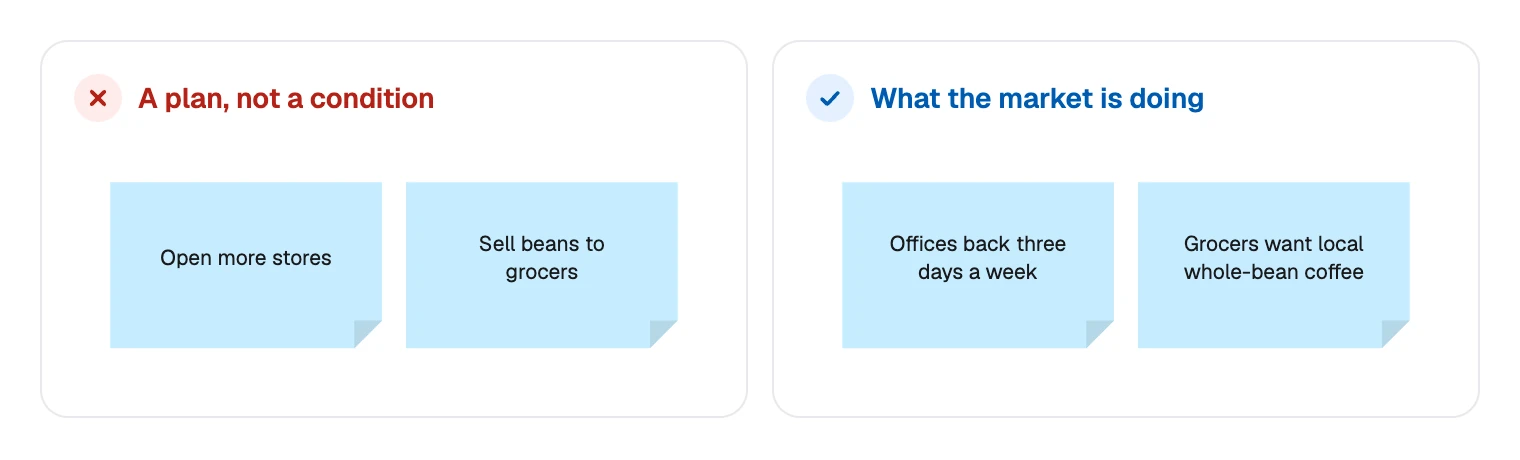
- Fill in the market quadrants. Ask what in the market you could use and what could hurt you. Write conditions, because the moves come later.
- Let people write alone first. In a group, a few quiet minutes before any discussion keeps the most senior voice from setting the list.
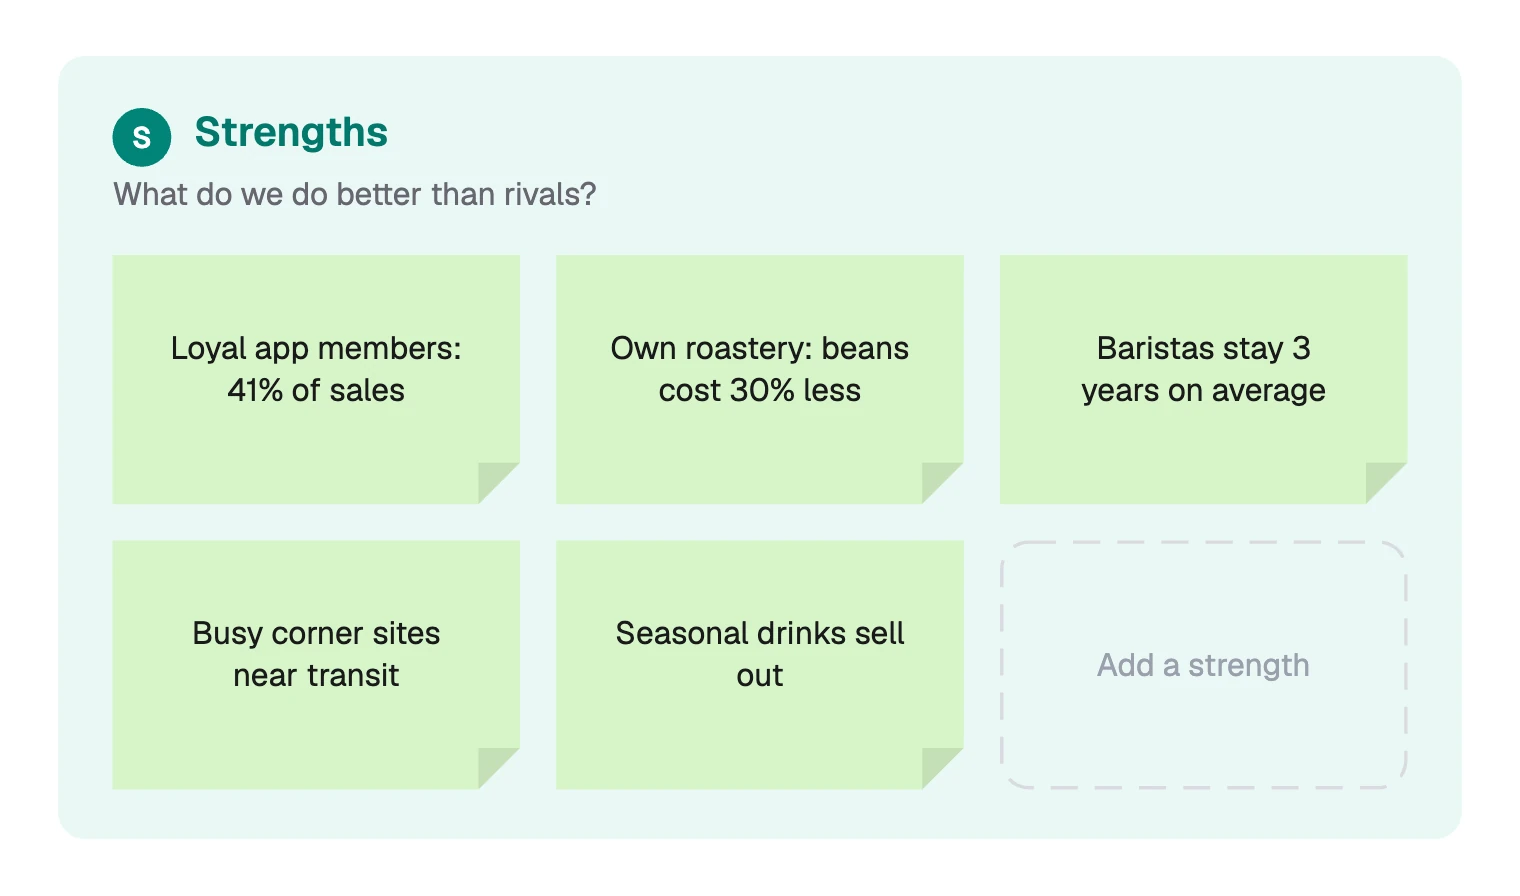
- Cut. Keep what would change a decision. The sample holds four or five notes per quadrant, and a dashed box shows where the next one goes.
- Pair the quadrants into moves, which is the next section.
- Give each move an owner and a date. Then set a time to look at the SWOT again.
Turning the quadrants into moves
This is the step most SWOTs skip. Pair an inside factor with a market one and ask what follows. This pairing is often called a TOWS matrix.
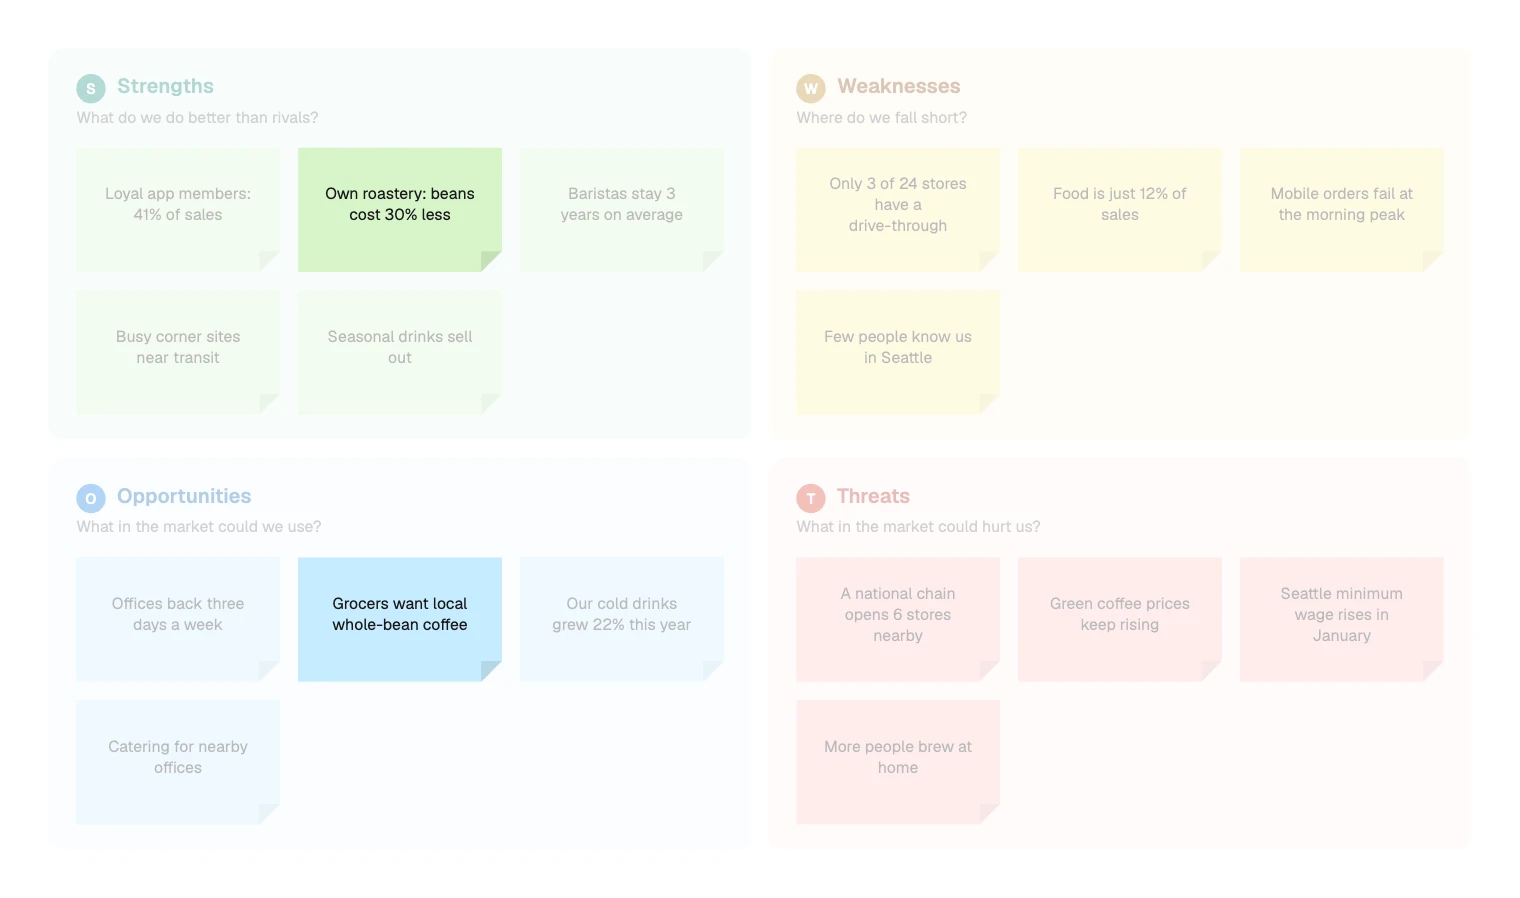
Those two notes suggest a move: Sell our beans in 40 local grocery stores. The sample’s Next moves column holds one card per kind of pair, each with its own logic:
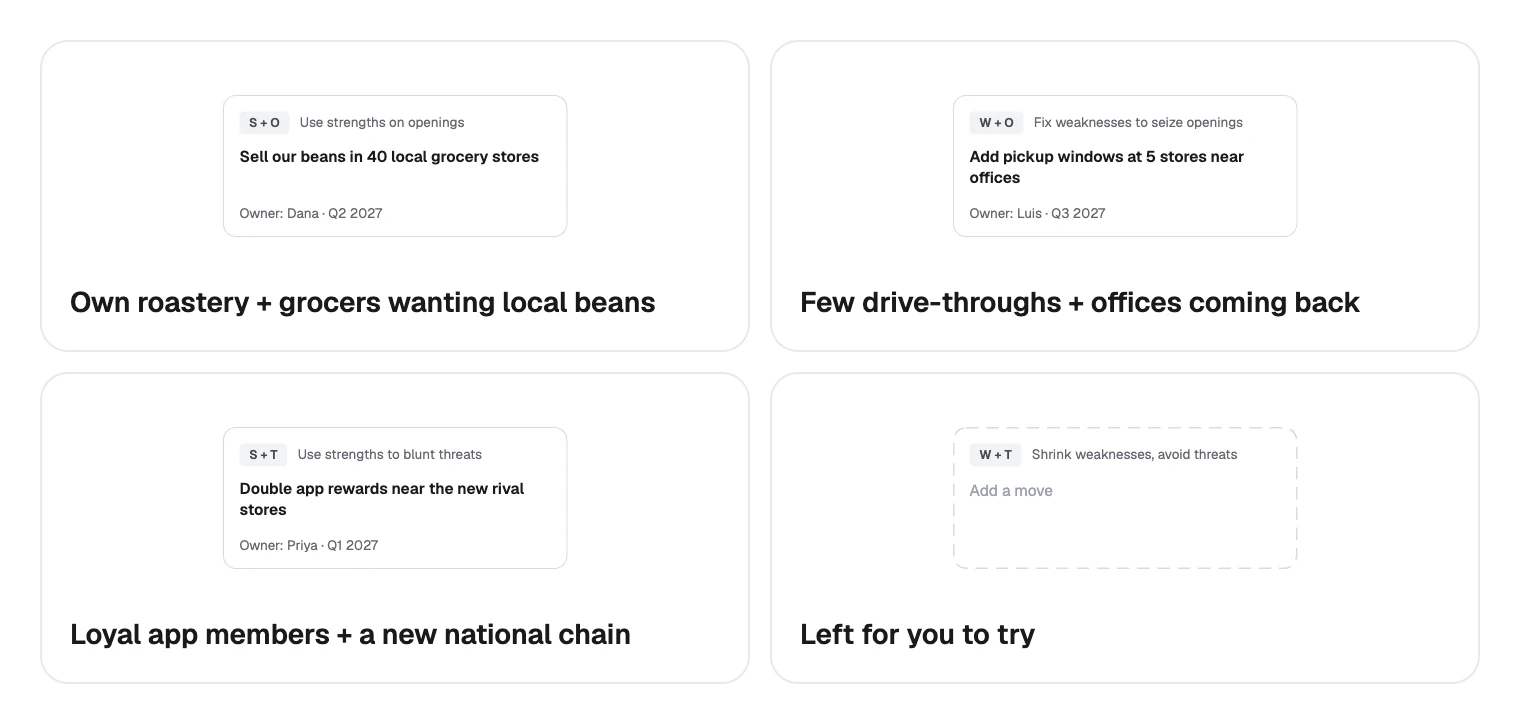
Each finished move has a line such as “Owner: Dana · Q2 2027”. The W + T box is empty so you can try it yourself.
One idea for it: fix “Mobile orders fail at the morning peak” before the new rival stores open.
Factors do not always sort neatly, and the sample shows that too:
- “Our cold drinks grew 22% this year” sits under Opportunities, yet a chain’s own sales are an inside fact. Read it as a hint about a market trend, then check that the trend holds beyond your own stores.
- “Seasonal drinks sell out” is listed as a strength, but it could also mean lost sales. Decide which is true for your goal and move on.
Running a SWOT analysis in FlowDraw
The template is free on every plan and uses 74 of a Free board’s 150 elements.
Open the template
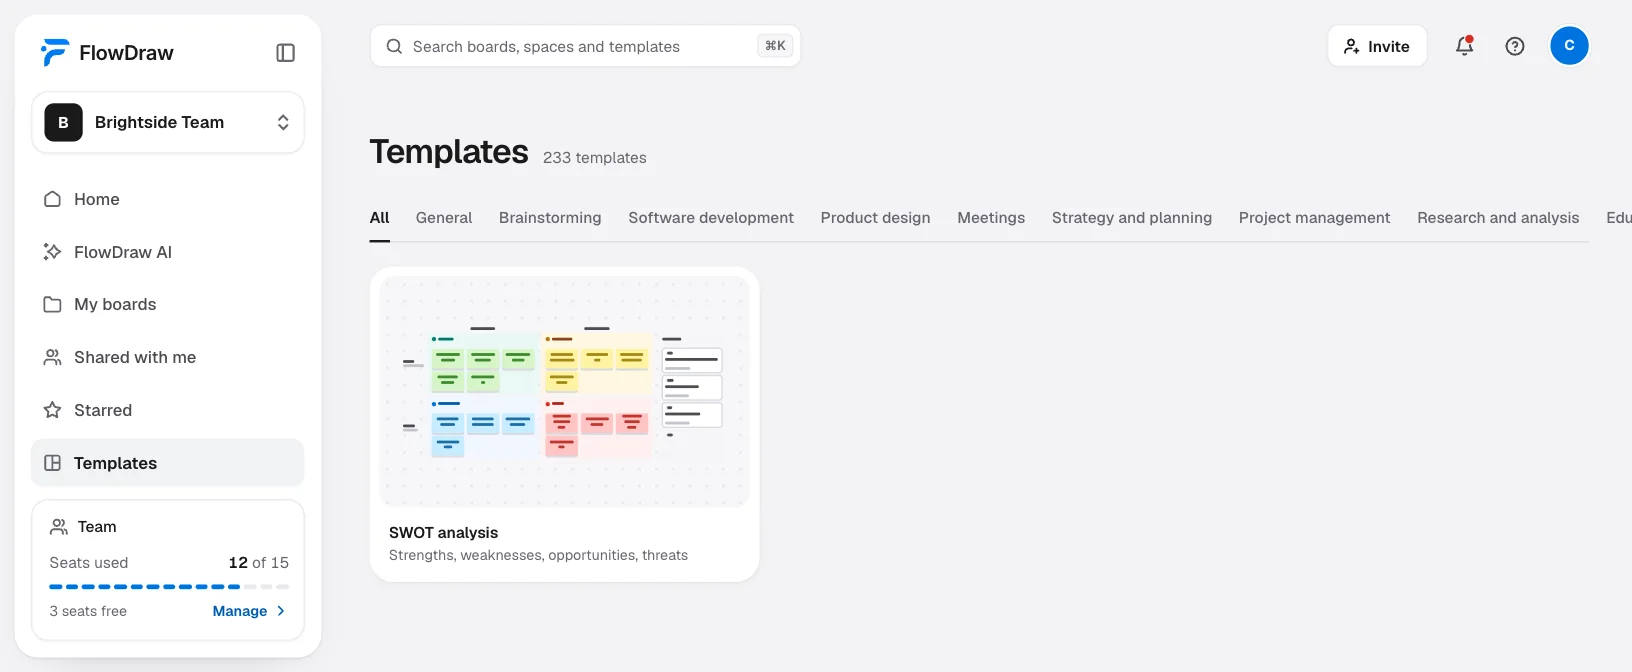
Go to “Templates” in the sidebar, search for “SWOT analysis” and choose “Use template” in its preview.
Clear the sample
Shift-click the Brightside notes and press ⌫. The boxes such as “Add a strength” only show where the next note goes, so delete them once a quadrant fills up.
Add your notes
With nothing selected, press N and pick a color to add a note. To keep a quadrant’s color, select one of its notes and press ⌘D (Ctrl+D on Windows) instead.
Bring in your team
Choose “Share” and use “Add people by email”. Once signed in, you can all add notes at once and see each other’s cursors. On Free, everyone you invite can edit. Pro is for one editor, so a group session needs Free or Team.
Write the moves
The lines under “Next moves” are text, so double-click to replace them, including the owner and date.
Share the result
Choose “Export”, pick “PDF” and set “Page” to the frame, or use “Present” to walk through it in a meeting.
Turn on “Show author” in “Sticky note properties” if you want names on the notes.
FlowDraw has no voting or timers, so use your own timer for the quiet writing. To rank notes, ask each person to add a sticky note with their initials beside the ones that matter most.
From a “Blank board”, press F for a frame, R for each quadrant and N for notes. For a quick version, “More tools” › “Table” gives you a grid, and “Table properties” sets its “Rows and columns”.
Common SWOT mistakes
| Mistake | What it looks like | What to do instead |
|---|---|---|
| No goal | “A SWOT of the company” | Name the decision it feeds |
| Plans in the Opportunities box | “Open more stores” | Write the market condition that makes that attractive |
| Inside and outside mixed up | “Strong brand” under Opportunities | Use the test: would it be true without you? |
| Vague entries | “Great team” | Add the evidence: “Baristas stay 3 years on average” |
| Four lists and nothing else | No moves, no owners | Pair the quadrants, then assign each move |
| Only leaders in the room | Weaknesses look small | Ask the people who talk to customers |
When you are ready to run one with your team, create a free account and open the template.
FAQ
Internal factors are things your organization has or does, such as its skills, costs and locations. External factors exist in the market whether you are there or not, such as new rivals, prices and laws. Strengths and weaknesses are internal. Opportunities and threats are external.