
How to make a decision tree
Learn how to make a decision tree: the three node types, how to work out expected value, and how to draw one from a free template in FlowDraw.
“Should we build it or buy it?” can fill a meeting, because each person is arguing from a different worry. A decision tree puts the options, risks and payoffs on one page, so the argument moves to numbers you can check.
To make a decision tree you need three symbols and some arithmetic.
Quick AnswerA decision tree maps a choice from left to right: squares for decisions, circles for uncertain events and triangles for final results. Add a probability to each uncertain branch and a payoff to each result, then work backwards from the right to find the expected value of every option.
What is a decision tree?
This guide covers the kind used in decision analysis, where you compare options whose results are uncertain.
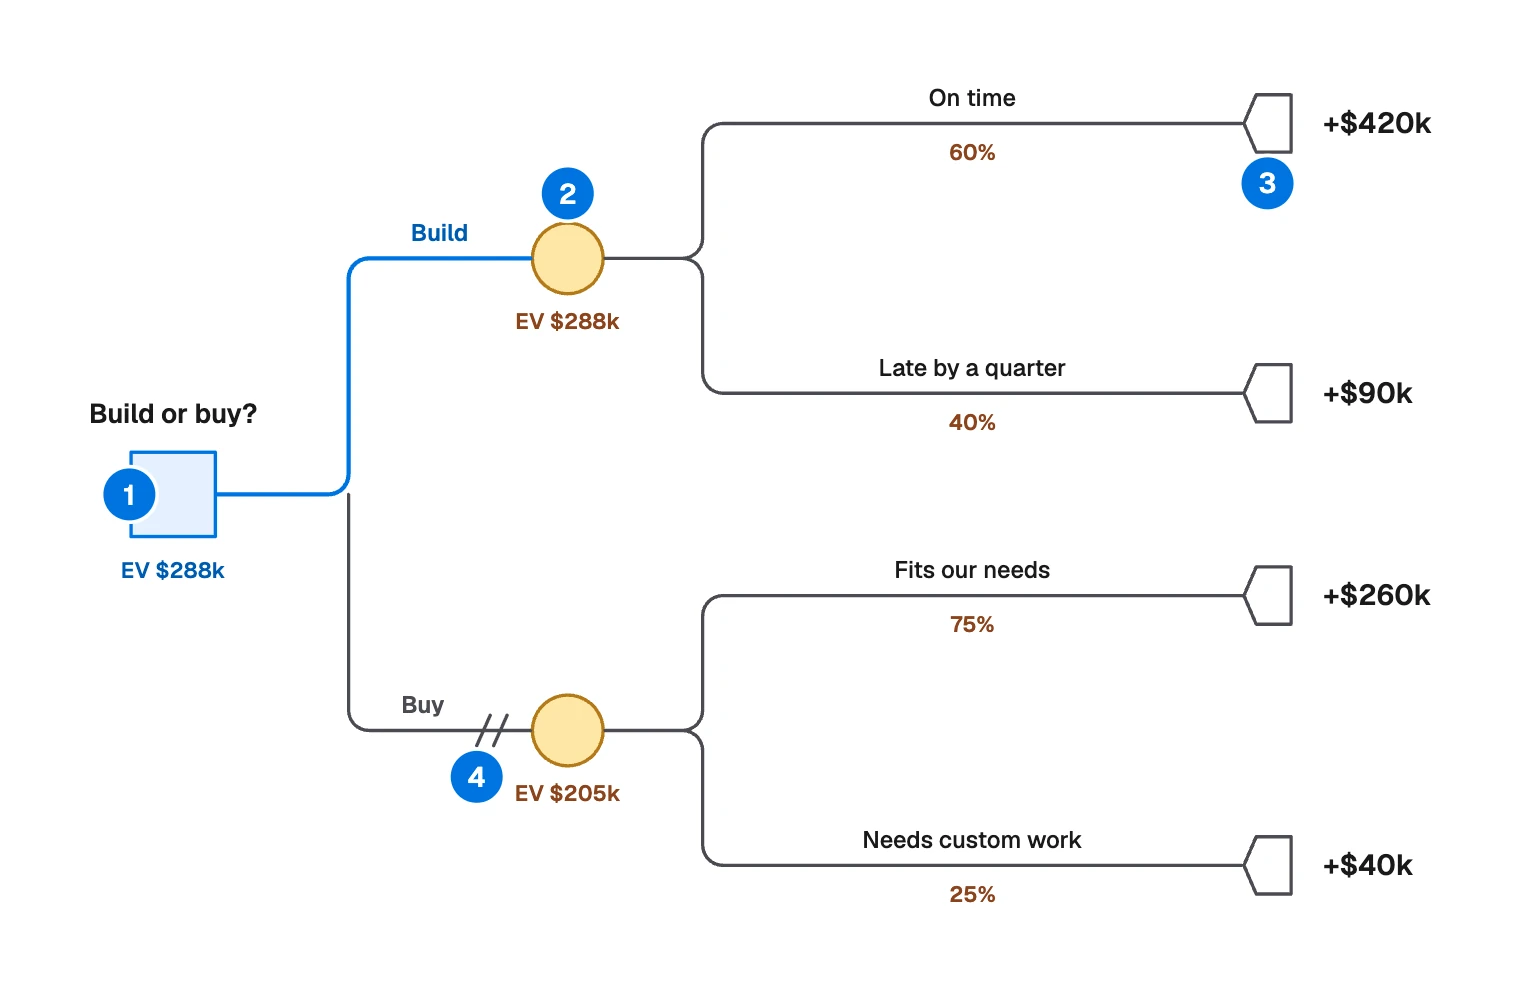
- Decision node, a square: you choose. Value it by taking the best branch.
- Chance node, a circle: something uncertain happens. Value it as the weighted average of its branches, whose chances add up to 100%.
- Outcome node, a triangle: the path ends, with its payoff beside it. The sample draws it as a small pointed marker.
- Rejected branch, two slashes: an option you did not take, drawn last, once the sums are done.
The name also covers two other things:
- Yes-or-no trees for triage or troubleshooting. They ask questions and have no probabilities, much like a flowchart. FlowDraw AI can draw a flowchart from a description, though not chance nodes and expected values.
- Machine learning trees, which an algorithm builds from data. Nobody draws these by hand.
Worked example: build or buy
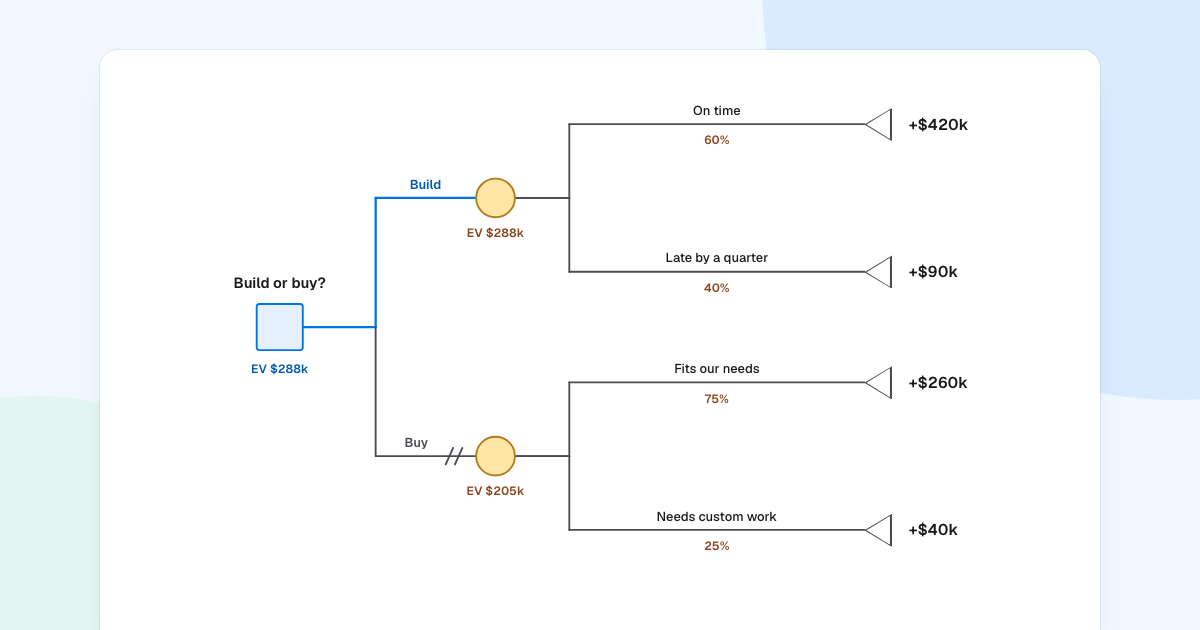
This sample comes with FlowDraw’s “Decision tree” template. The chances and the money are made up.
Each option leads to a circle, because neither result is certain. To solve the tree, work from right to left. At each circle, multiply every payoff by its chance and add them up:
| Option | Outcome | Chance | Payoff | Chance × payoff |
|---|---|---|---|---|
| Build | On time | 60% | +$420k | $252k |
| Build | Late by a quarter | 40% | +$90k | $36k |
| Build | Expected value | $288k | ||
| Buy | Fits our needs | 75% | +$260k | $195k |
| Buy | Needs custom work | 25% | +$40k | $10k |
| Buy | Expected value | $205k |
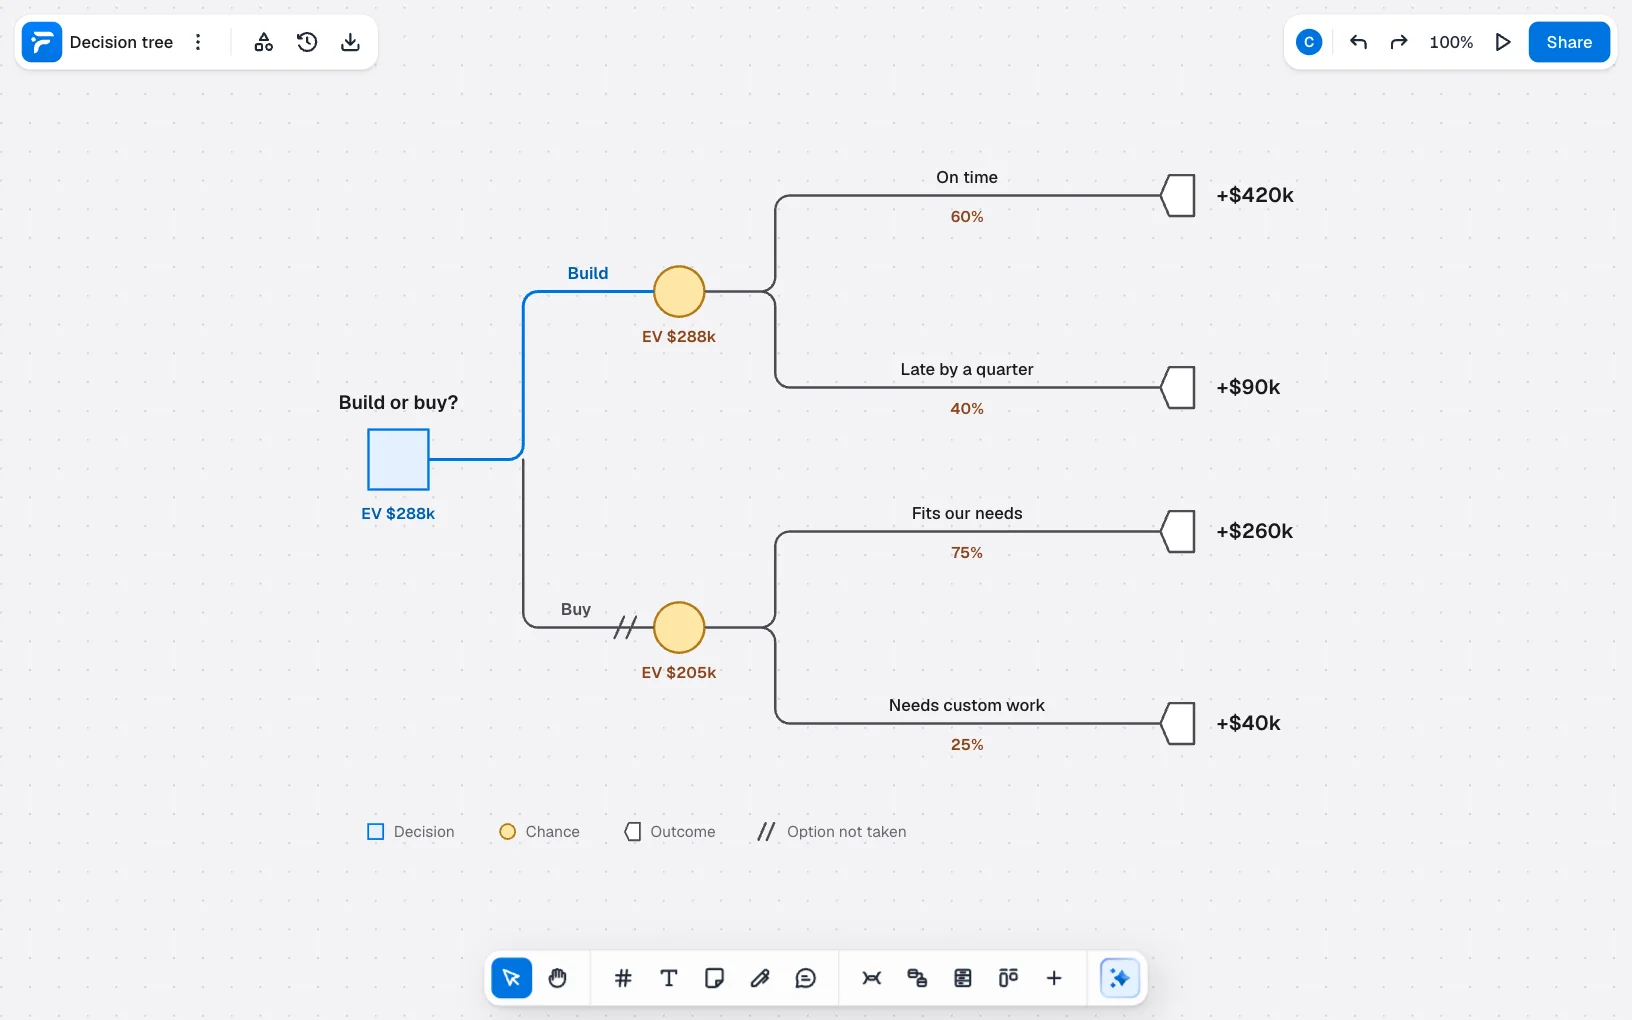
The square takes the better of the two, so it reads EV $288k as well. EV stands for expected value.
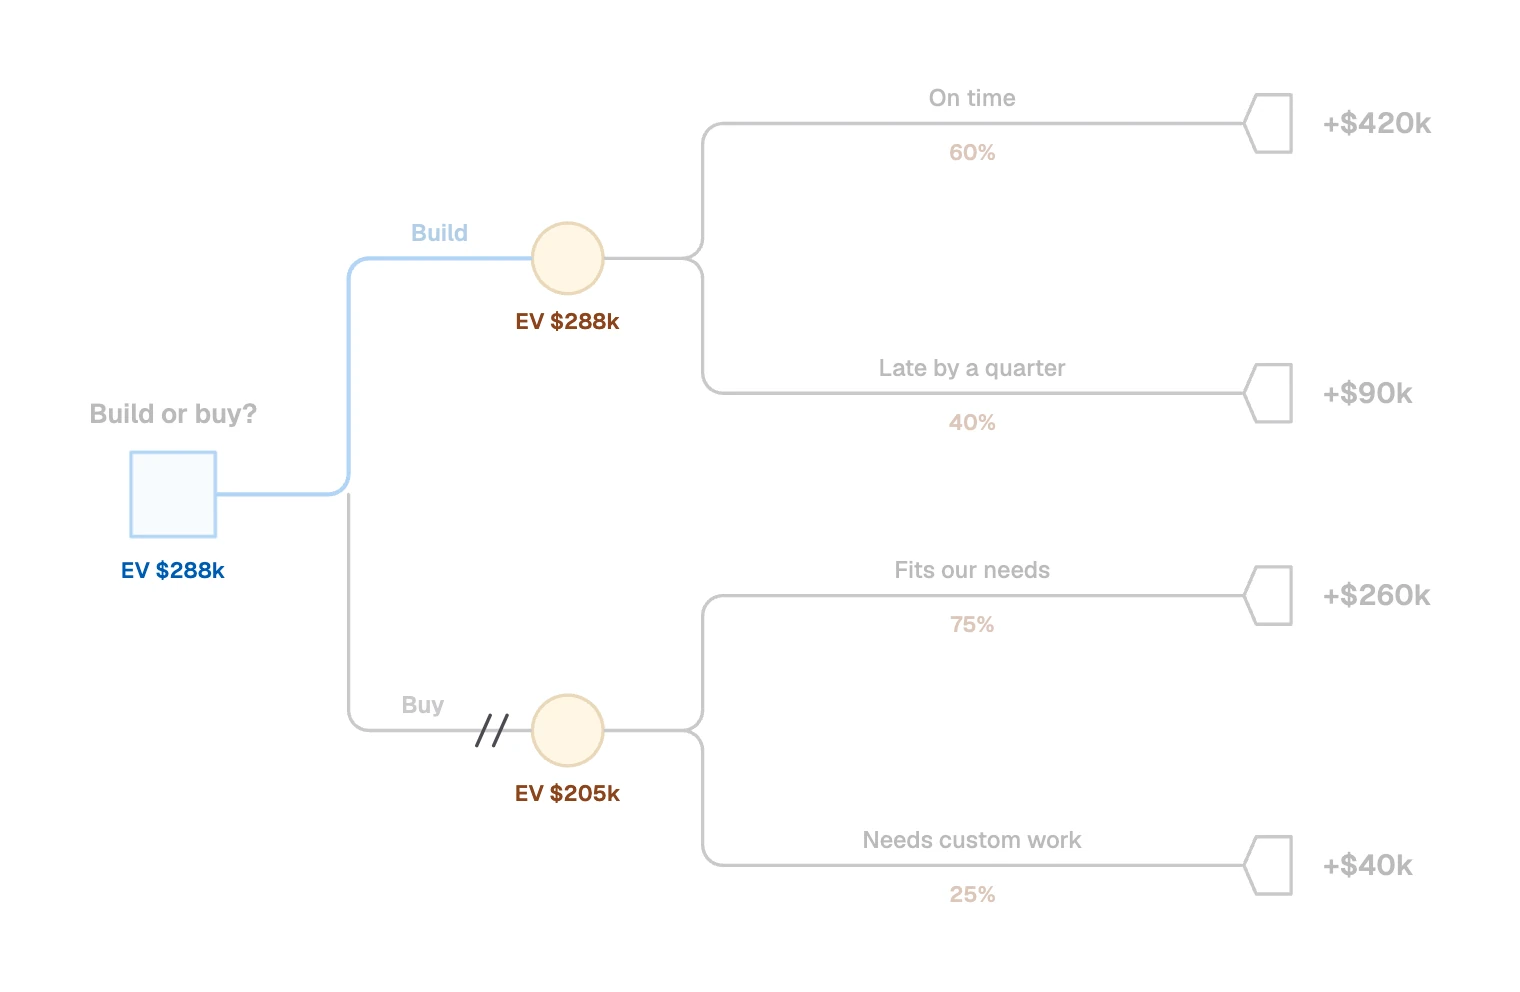
Do not stop at the answer. Expected value is an average, and you will make this decision once. Two checks help:
- Can you live with the worst case? In the sample that is +$90k for Build and +$40k for Buy.
- How wrong would an estimate have to be? Build stays ahead while its chance of being on time stays above about 35%, because 35% of $420k plus 65% of $90k comes to about $205k. If the team doubts that, you know which number to research.
How to make a decision tree
- Write the decision as a question with a yardstick. “Which option earns the most over three years?” Every payoff must then use the same unit and the same time span.
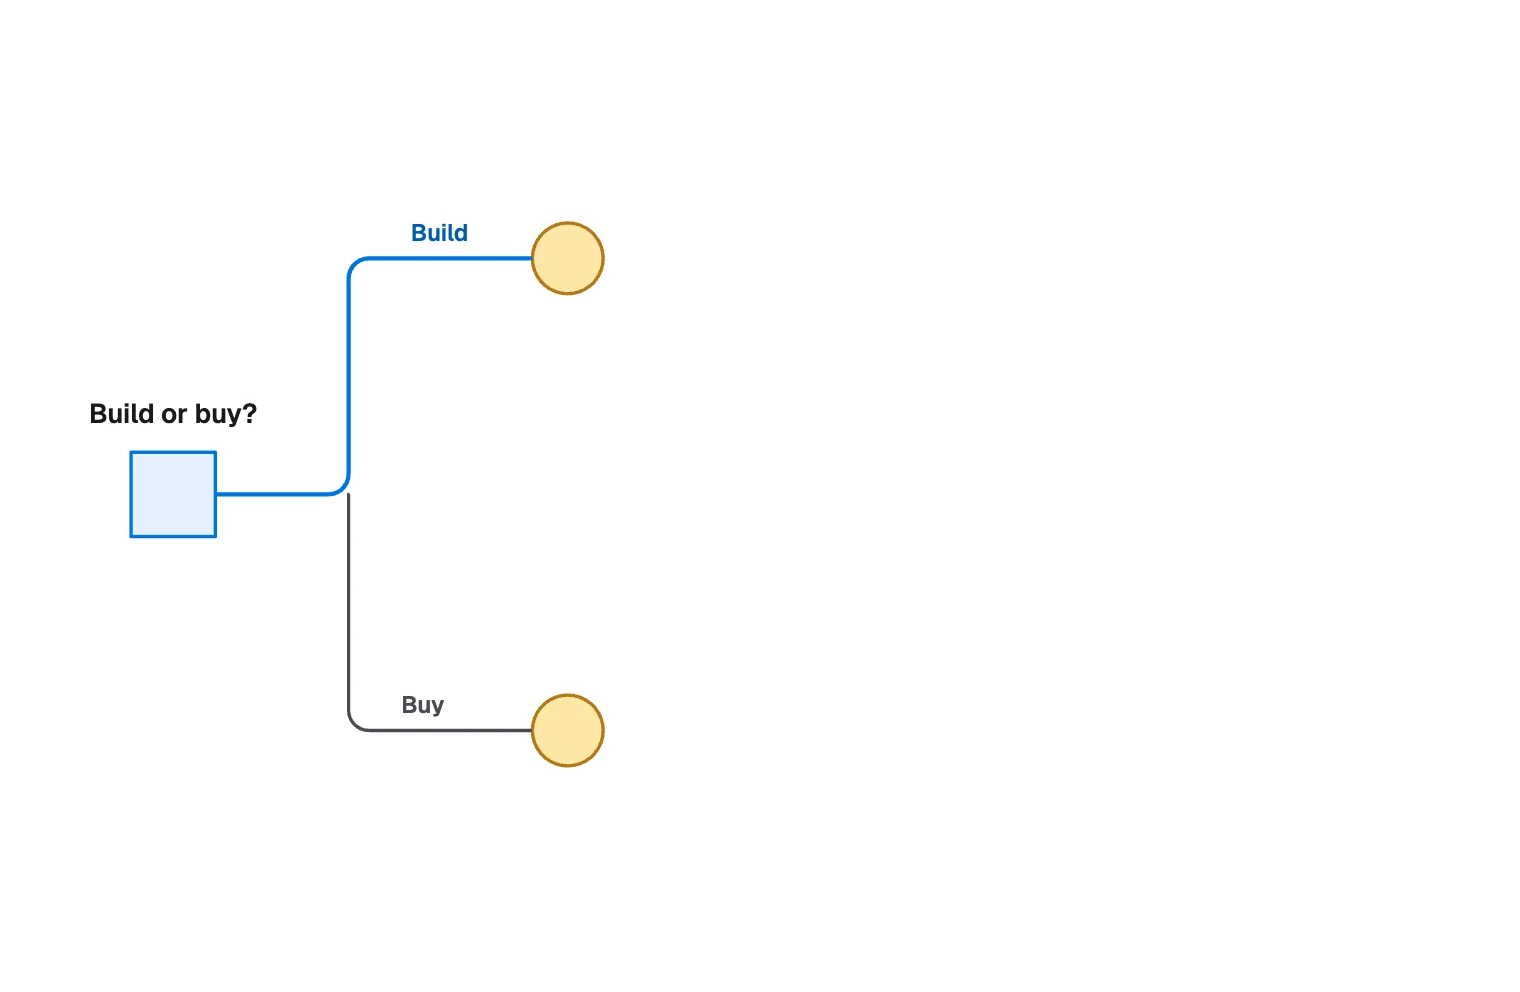
- Draw the options. Start from a square, one branch per option. Include “do nothing” if it is a real choice.
- Add what could happen. After each option, add a circle for the uncertainty that would change the result most. Two or three branches are usually enough.
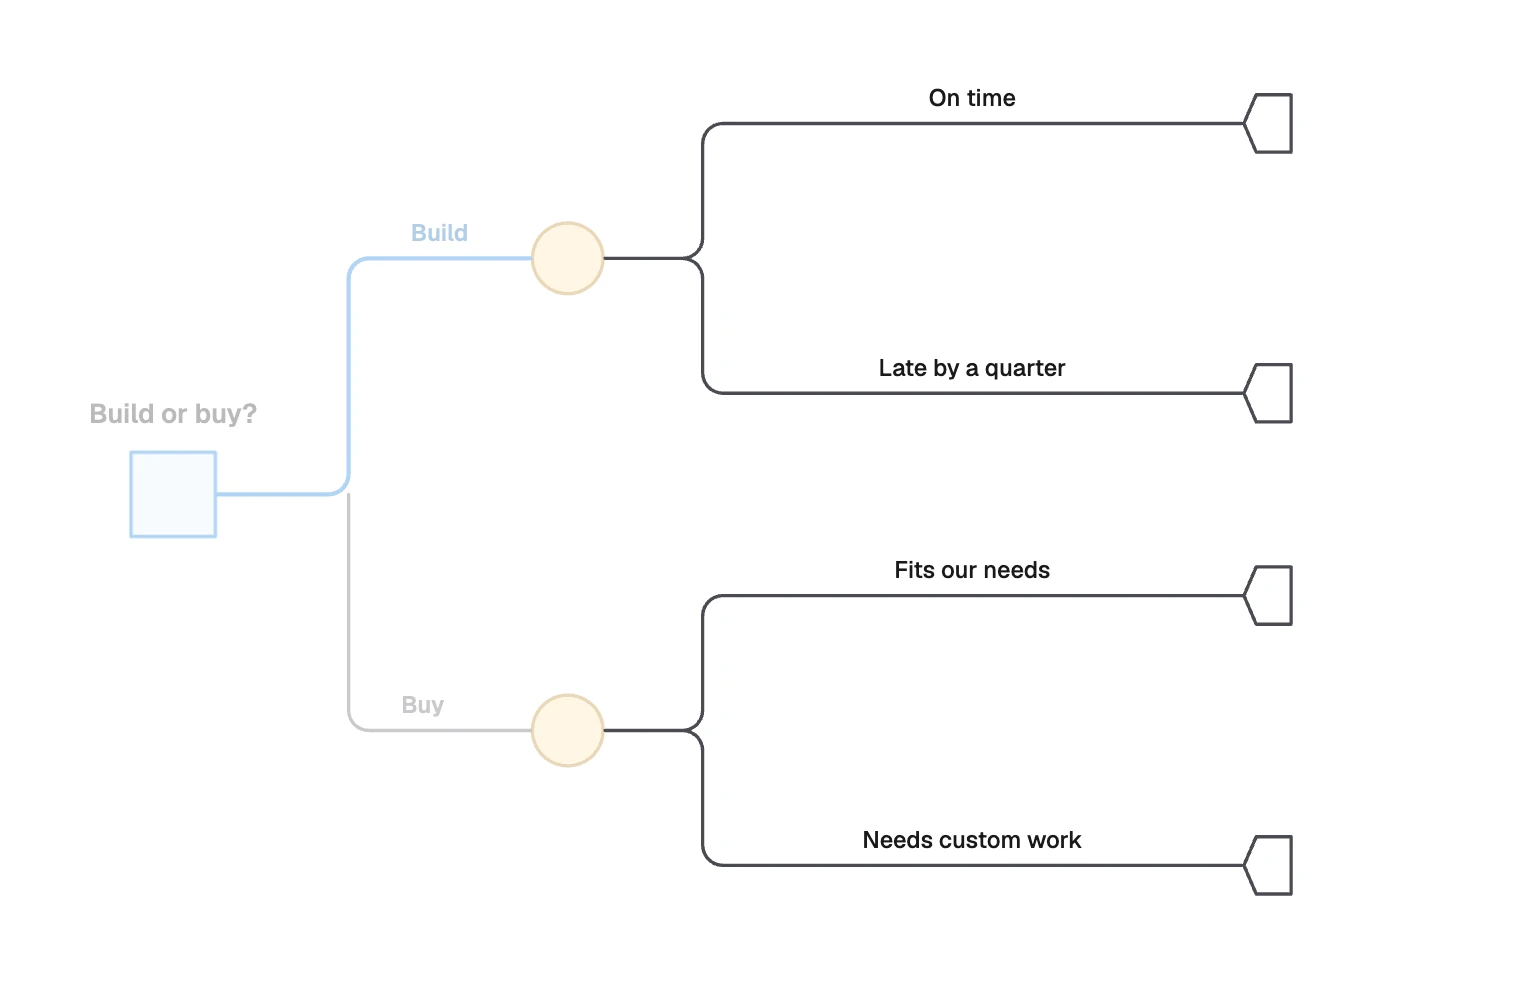
- Add later choices. If you would decide something after an event, such as cutting scope once a project runs late, that is another square further along the path.
- Estimate the chances. Use past projects, references and the people who would do the work. Check that each circle adds up to 100%.
- Work out the payoffs. Write the net value at the end of each path: everything gained minus everything spent on the way there.
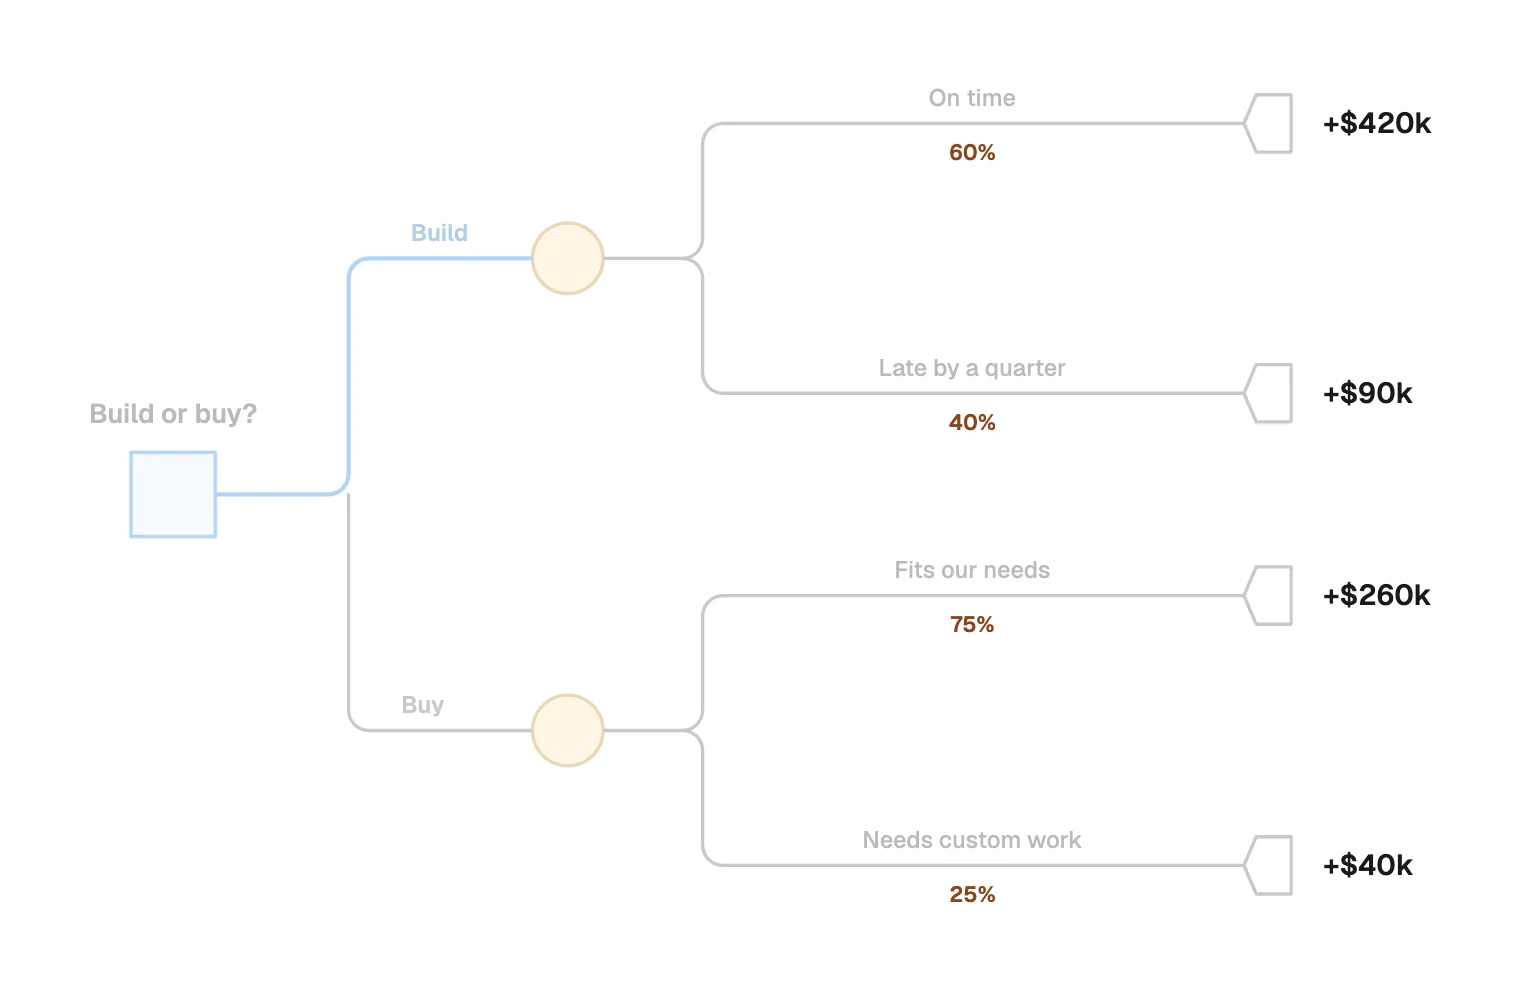
- Solve it from the right. A circle takes the weighted average, and a square takes its best branch. Slash the rest.
- Test it. Change the estimates you trust least and see whether the answer moves.
When to use something else
- Several options scored on several criteria, with little uncertainty: the “Decision matrix” template fits better.
- A quick read of both sides of one choice: try “Pros and cons”.
- You do not know the options yet: a SWOT analysis can suggest them, and a tree can then compare them.
How to draw it in FlowDraw
The template is free on every plan and uses 42 of the 150 elements a Free board can hold.
Open the template
Go to “Templates” in the sidebar and search for “Decision tree”. The “Use template” button in its preview makes a new board.
Rewrite the labels
Every label and figure is its own text box. Double-click one to edit it, and press Esc when you finish.
Add a branch
Shift-click an outcome marker and its labels, press ⌘D (Ctrl+D on Windows) and drag the copies into place. Hover the circle and drag from the spot beside it to the new marker. In “Line properties”, “Elbow” gives you the same square corners.
Redo the sums
The figures are plain text, and FlowDraw does not calculate anything. Each time you change a chance or a payoff, update every EV label back to the first square.
Mark the choice
The two slashes are short “Straight” lines, so copy them onto the branch you reject. The sample also shows the chosen path in blue, which you can set with “Line color”.
Ask for comments
Choose “Share” and give people “Can comment”. They can press C and click a probability to question it.
On a “Blank board” from Home, press R for a decision square, O for a chance circle and L for connectors, with Esc between them, take “Triangle” from “Basic shapes” for outcomes, and press T for text.
FlowDraw cannot rotate a shape, so a triangle keeps its direction. For the sideways markers in the sample, use “More tools” › “Templates…” to insert the template on your board and copy them.
Common decision tree mistakes
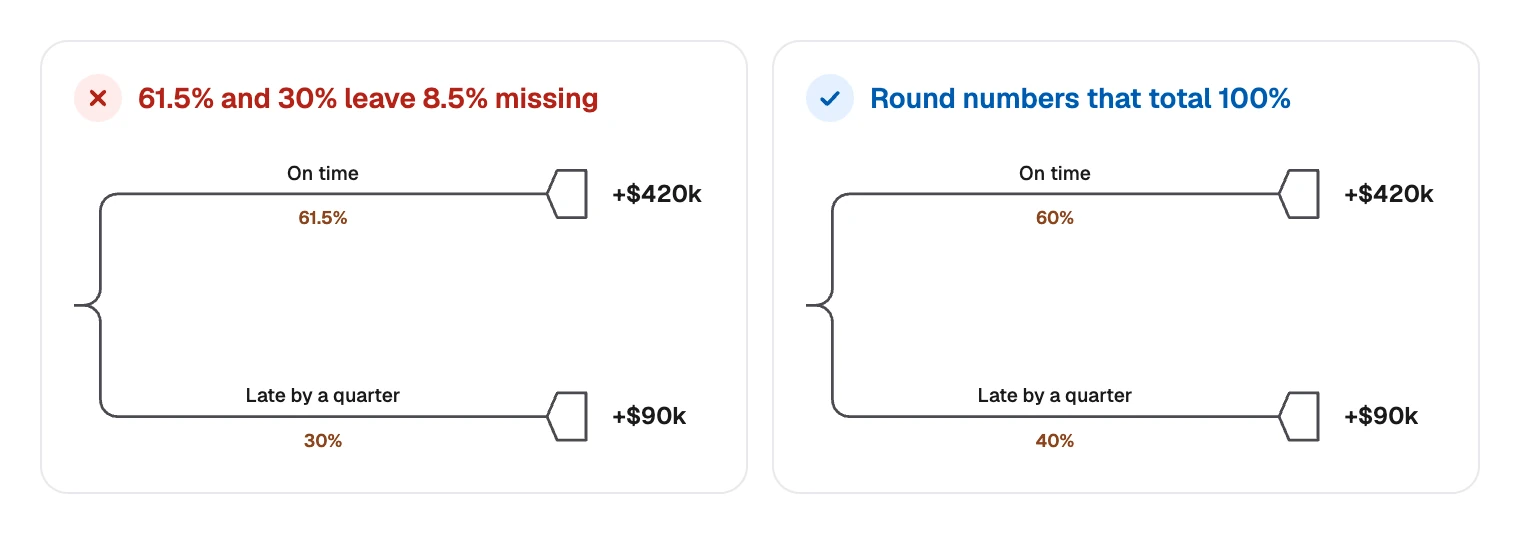
Chances that do not add up. Each circle’s branches must total 100%. If they do not, an outcome is missing or a number is wrong.
False precision. Writing 61.5% claims knowledge you do not have. Round your estimates, then test how much they matter.
Counting a cost twice. If a payoff is already net of the build cost, do not subtract that cost again along the branch.
Too many branches. A tree that needs several screens usually models detail that does not change the decision.
Working backwards from the favorite. If you adjust the chances until the preferred option wins, the tree only decorates a choice already made. Write the estimates down before you do the sums, ideally with the people who disagree.
FAQ
Work from right to left. At each chance node, multiply every payoff by its probability and add the results. At each decision node, take the best branch. In the sample, 60% of +$420k plus 40% of +$90k gives $288k.