
How to make a value stream map
Learn how to make a value stream map: walk the process, time each step and wait, draw the ladder, mark the waste and plan a better future state.
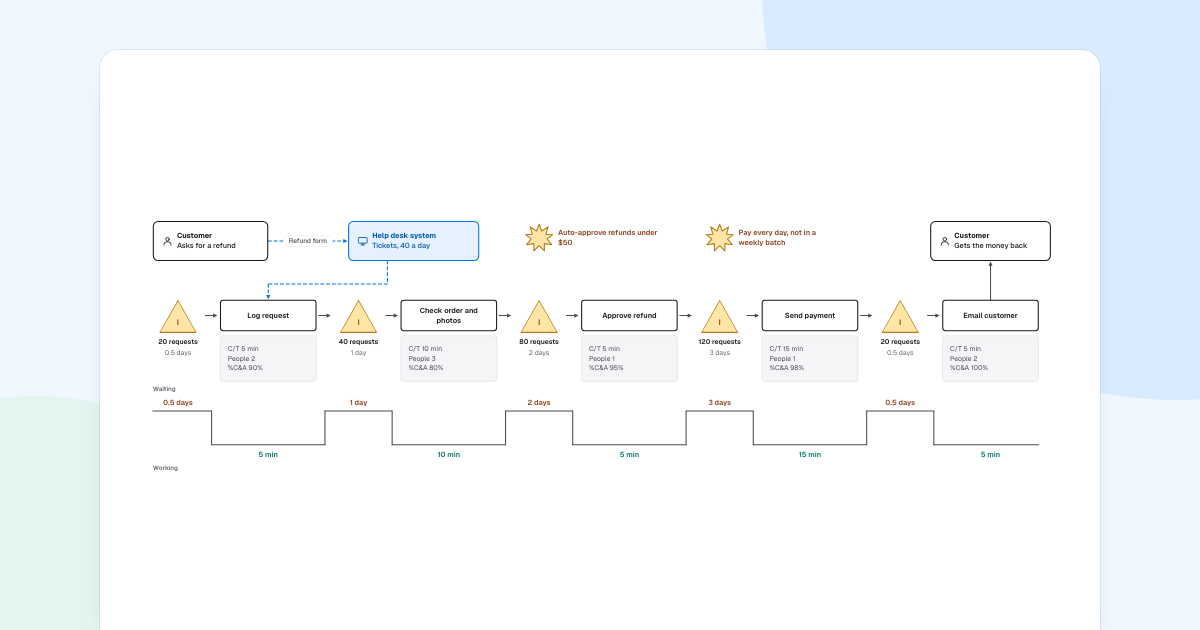
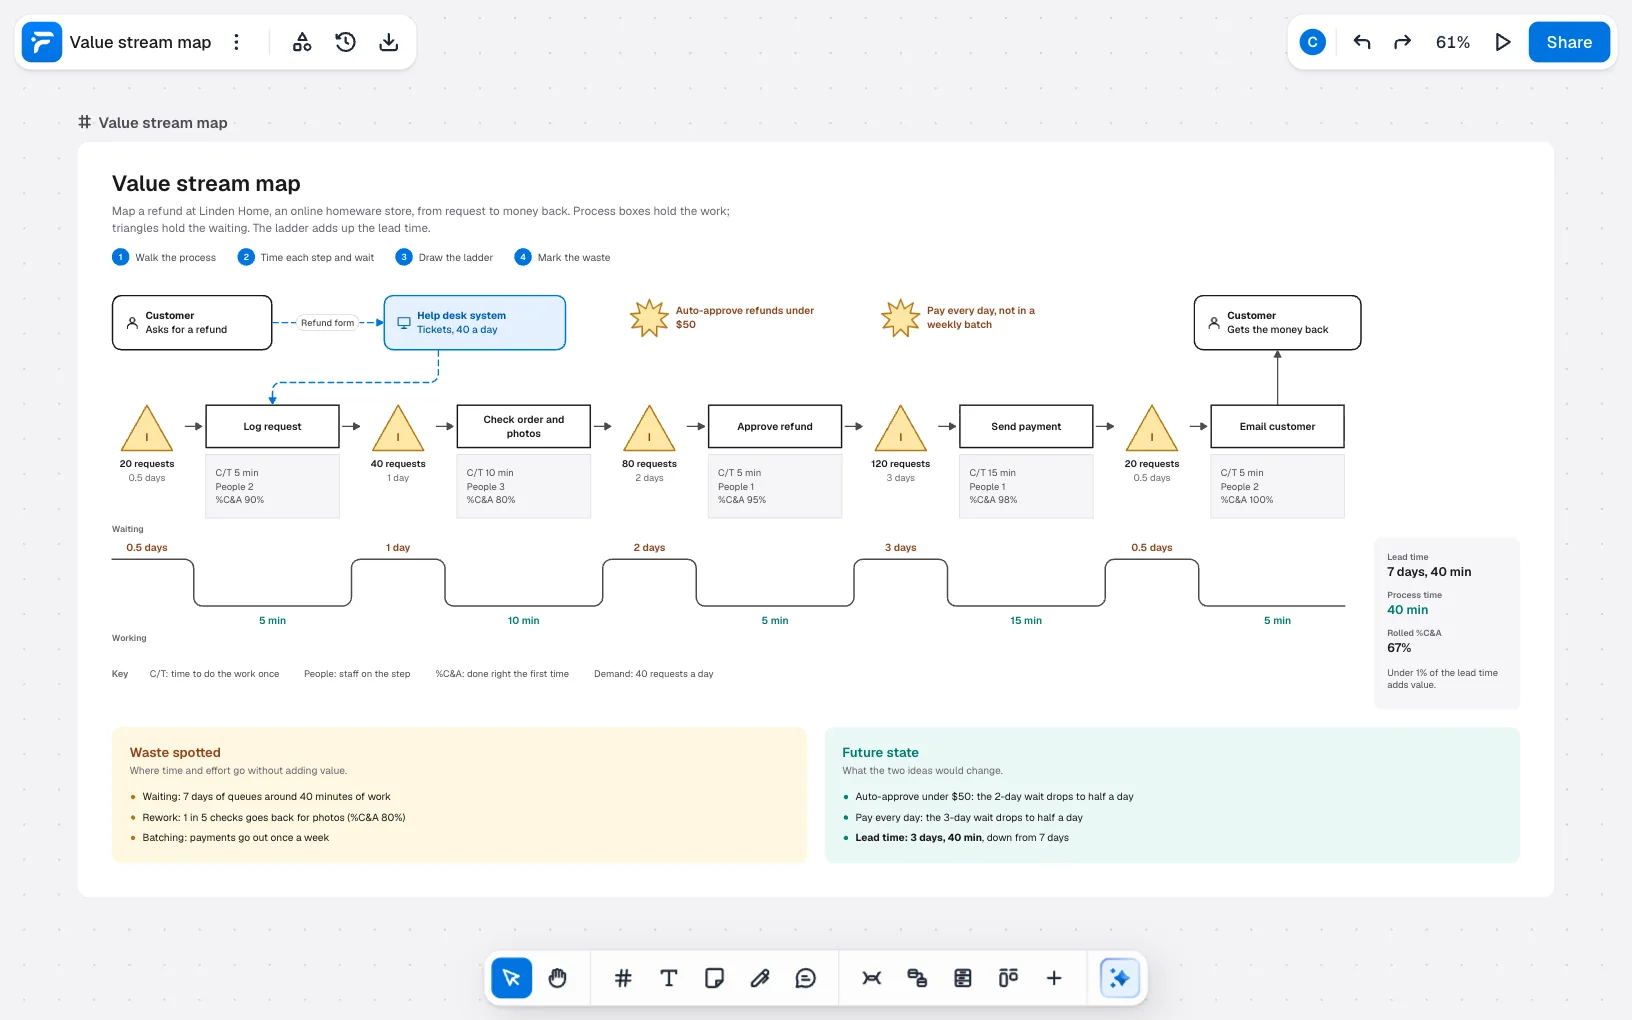
A refund at Linden Home, an online homeware store, takes 7 days and 40 minutes. Forty of those minutes are work. A value stream map is how you find that out, and it shows you which of the waits to attack first.
Quick AnswerA value stream map follows one process from request to delivery and shows the time spent working and waiting. To make one, walk the process, time each step and queue, draw the ladder that adds up the lead time, mark the waste, then plan a future state.
What is a value stream map?
It comes from lean manufacturing at Toyota, and the book Learning to See by Mike Rother and John Shook made it widely known. It also suits office work like this refund.
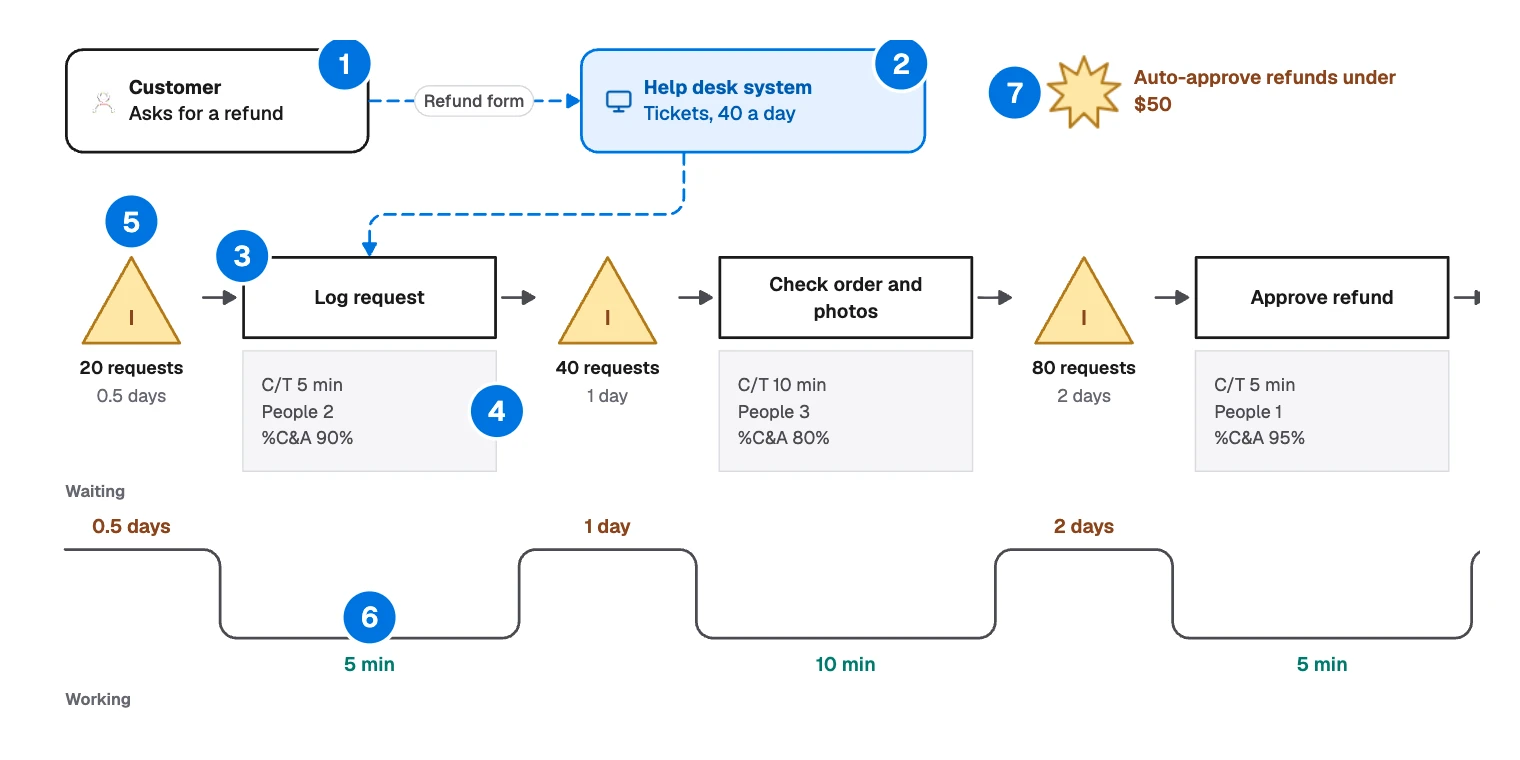
- Customer: who starts it and who receives the result.
- Information: how the request travels, shown by dashed lines here.
- Process box: one step of the work.
- Data box: the numbers for that step.
- Triangle: a queue where work waits. The “I” stands for inventory.
- Ladder: waiting on the upper level, working on the lower.
- Kaizen burst: an improvement idea.
Use one when a process feels slow and nobody knows why. To see who hands work to whom, use a swimlane diagram instead. For the causes of one fault, a fishbone diagram fits better.
How to make a value stream map
Walk the process
Follow one real request from start to finish, and go and look instead of asking how it should work. Keep to steps where someone adds something.
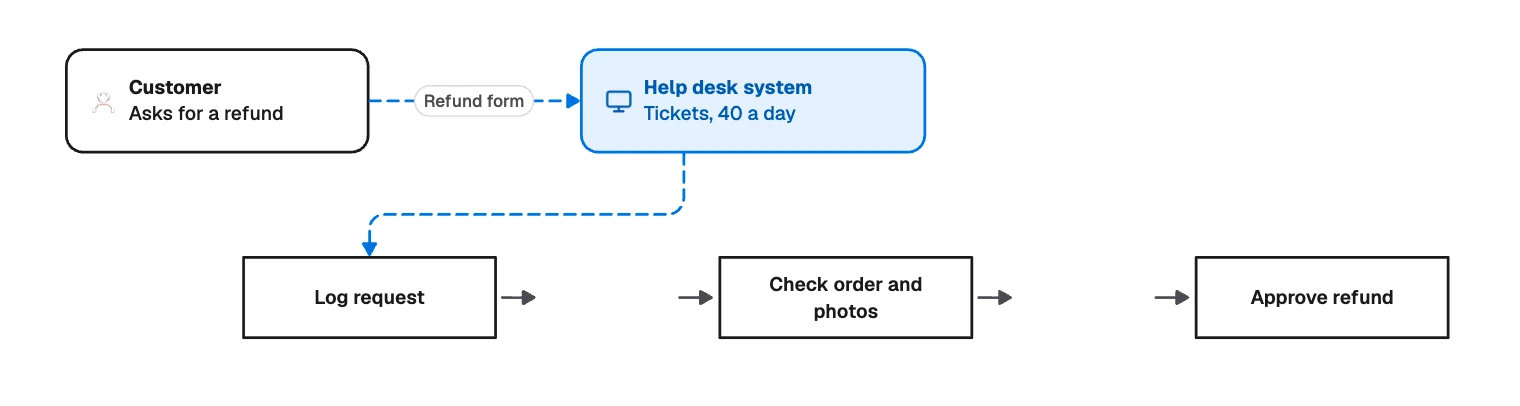
The refund has five steps: Log request, Check order and photos, Approve refund, Send payment and Email customer. Keep each box to something a person could time.
Time each step and wait
Fill in a data box for each step, and count the queue in front of it.
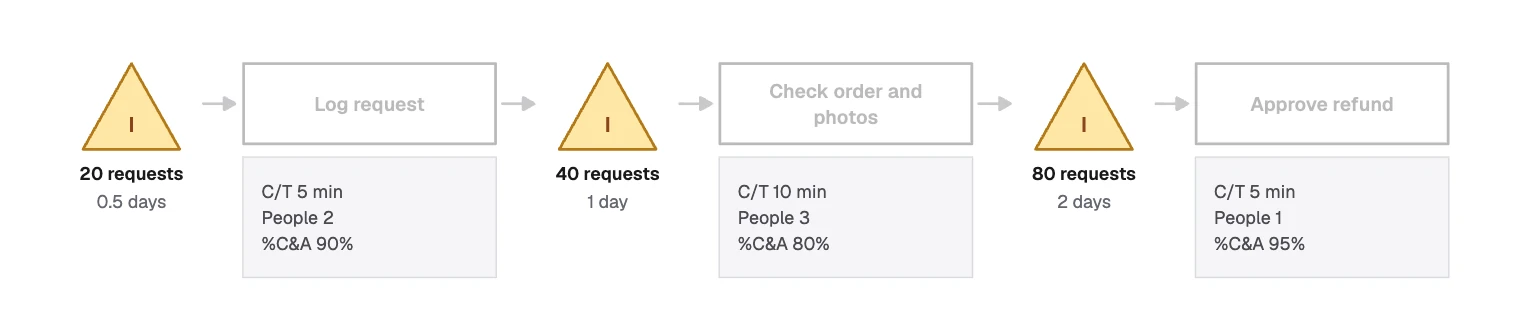
| On the map | Meaning | Example |
|---|---|---|
| C/T | Cycle time: to do the work once | 10 min |
| People | Staff on the step | 3 |
| %C&A | Done right the first time | 80% |
| Queue | Requests waiting | 40 requests |
To turn a queue into a wait, divide by demand. Demand here is 40 requests a day, so 120 waiting is 3 days. Factory maps often record changeover time and uptime as well.
Draw the ladder
The ladder puts every wait above the line and every step below it, so the two sums are easy to read.
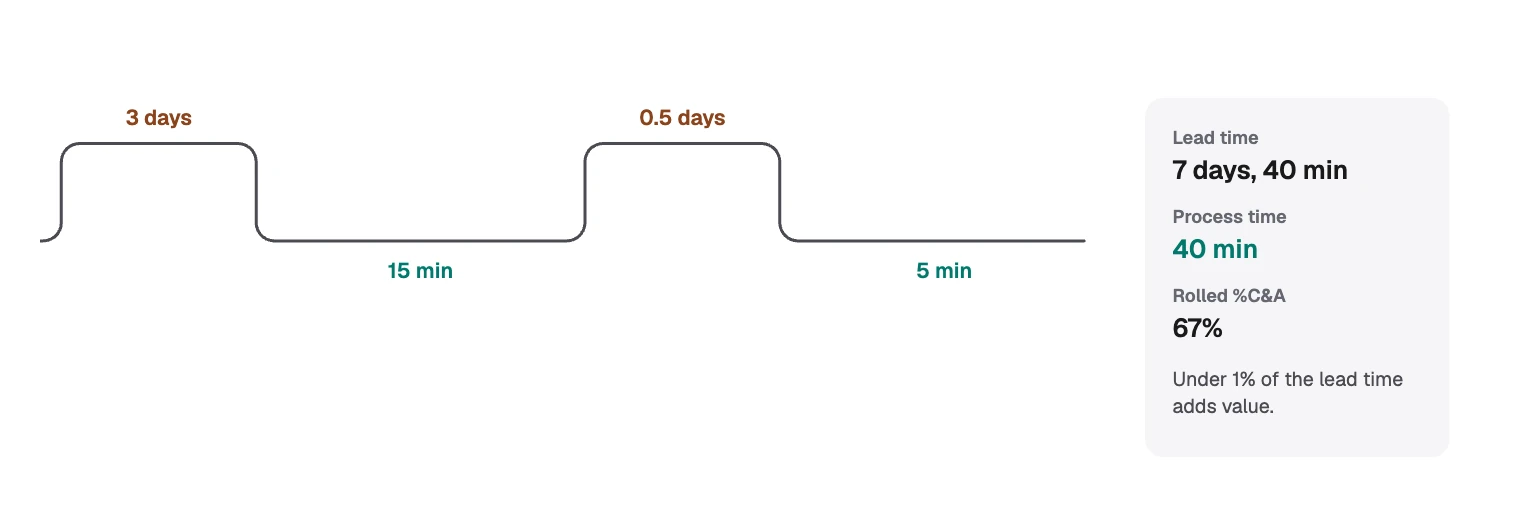
- Lead time: all of it added together, 7 days and 40 minutes.
- Process time: the work alone, 40 minutes.
- Rolled %C&A: each step’s figure multiplied together, 67%.
Counting full days, under 1% of the lead time adds value. That figure usually changes the conversation.
Mark the waste
Now look for what the numbers point at. Put a kaizen burst over each place you want to change.
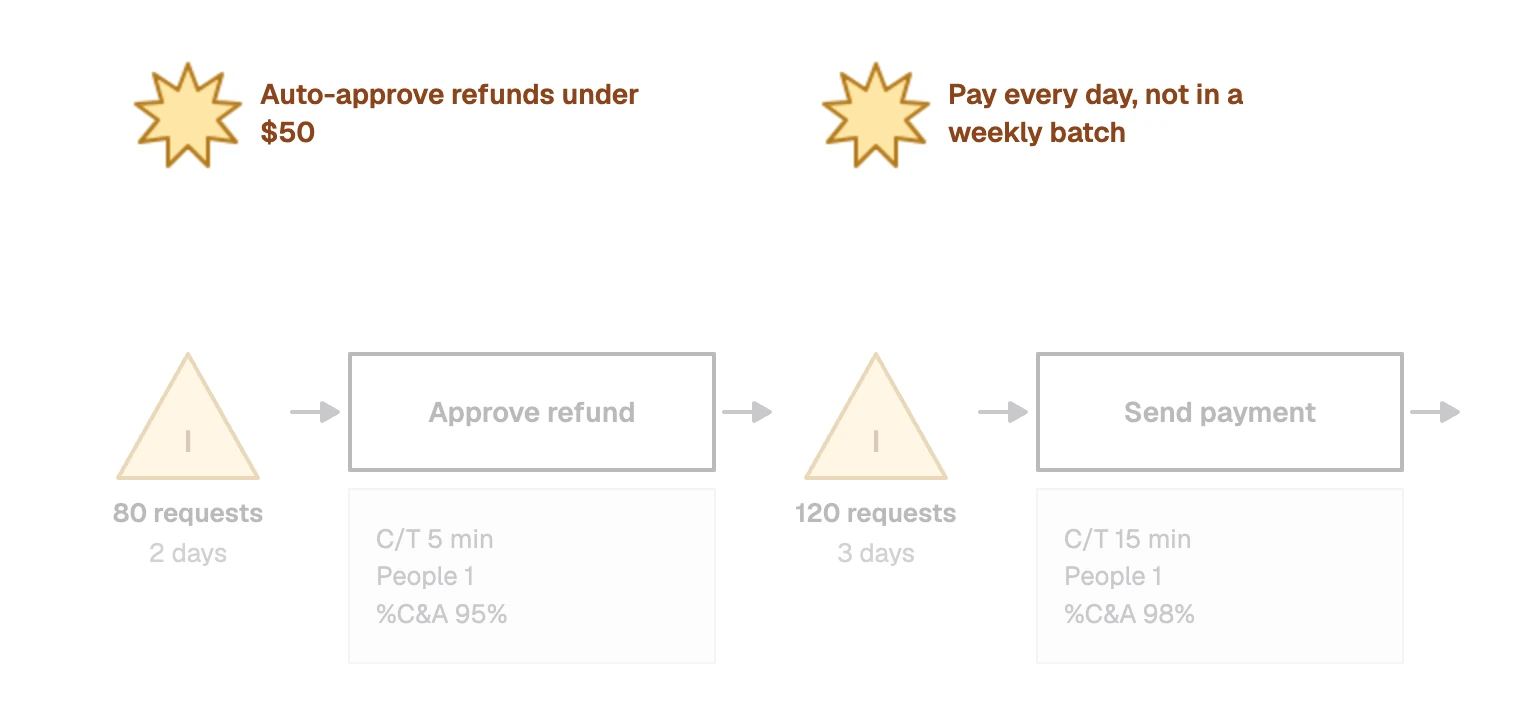
Start with the longest queues, not the slowest steps. Saving five minutes on Send payment does little against the 3 days in front of it.
Plan the future state
Write what each idea would change, in the same numbers. This is a forecast until you try it.
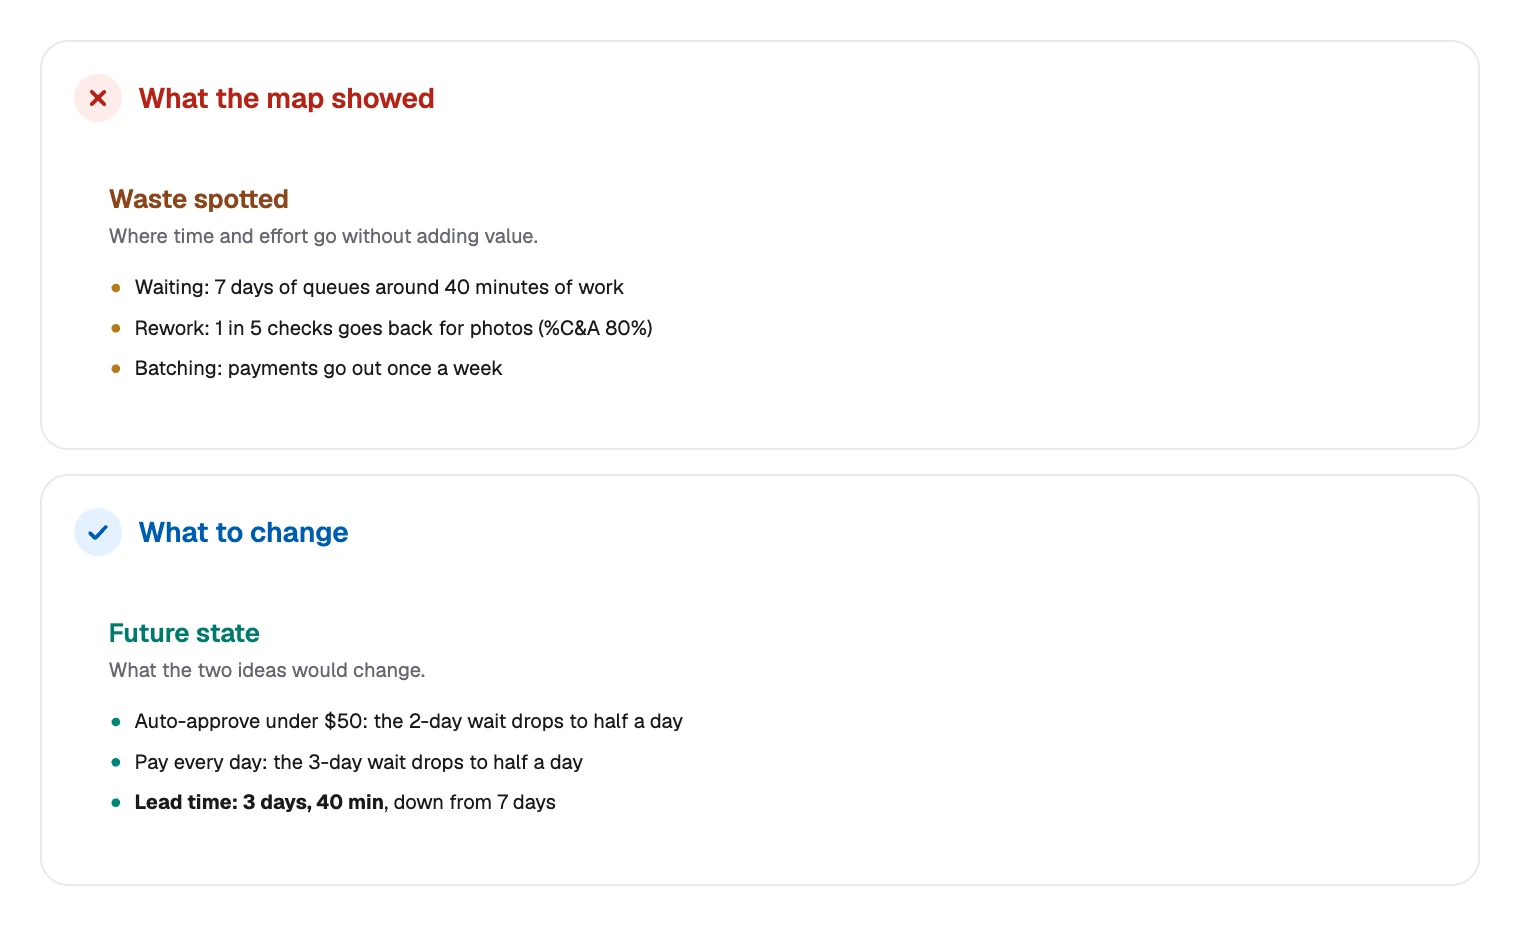
Teams usually draw a second map for this, then a plan to reach it.
Drawing a value stream map in FlowDraw
The template is free, and Free can edit and copy everything on it. Its triangles are basic shapes and its bursts are images. The separate Value stream map library, with cells such as Inventory and Kaizen burst, needs Pro.
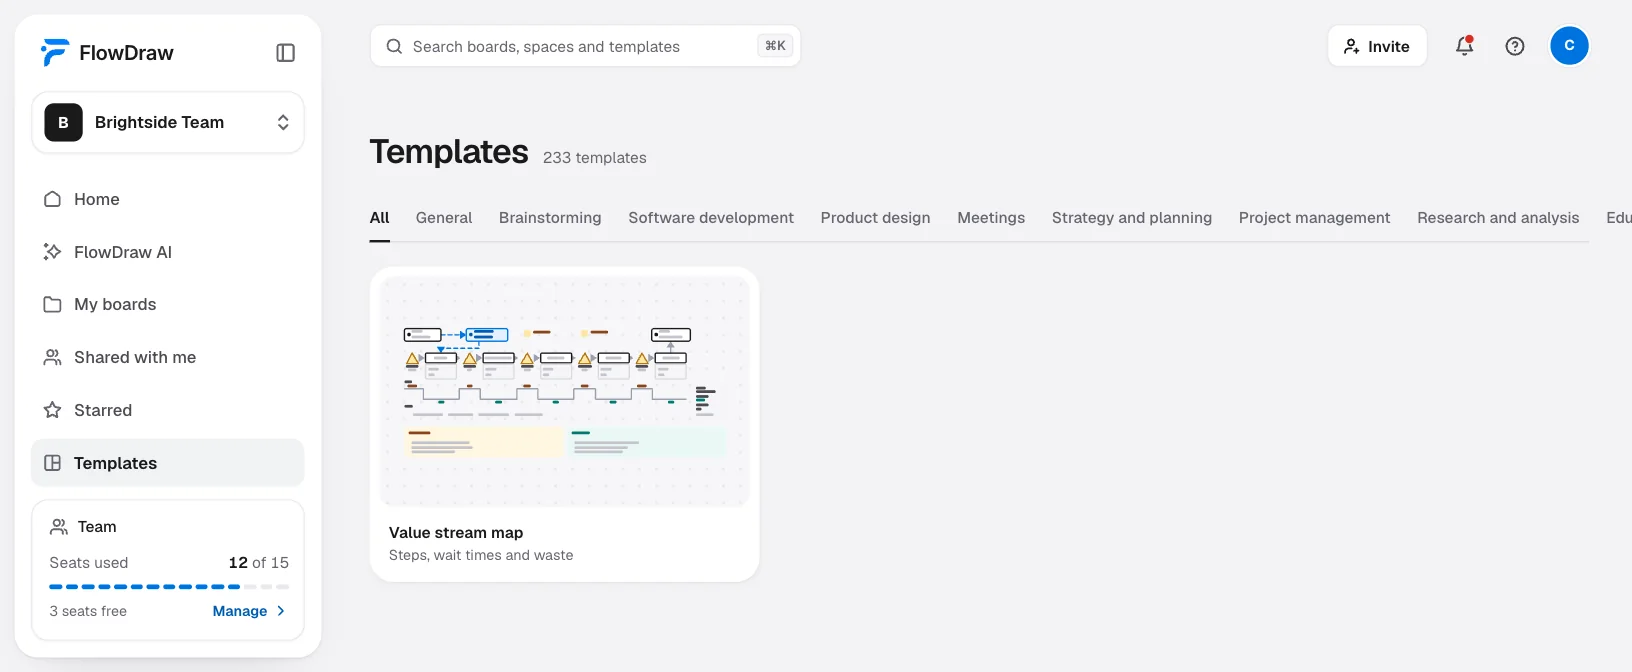
Open the template
Search for “Value stream map” under “Templates”, open the card, then choose “Use template”.
Enter your own numbers
Double-click any label or data box and type. FlowDraw does not calculate on a board, so work out the totals yourself and type those in too.
Rename the steps
Double-click a process box. Five steps suit the template as drawn, with no redrawing.
Add or remove a step
Shift-click the triangle, its two labels, the box, the data box and the arrows, then press ⌘D (Ctrl+D on Windows) or ⌫. The arrows between steps have free ends, so they stay put if you move a box alone.
Change the ladder’s length
The ladder is one line with its corners stored. Dragging an end redraws it with fewer bends. For another length, delete it, press L and draw each part, with “Straight” and end “None” in “Line properties”.
Review it with the team
Choose “Share” and add people. On Free everyone you invite can edit. On Pro only one person can, so others press C and comment.
Maps like this go stale when the process changes, so plan to redraw them rather than trust an old one. “SIPOC” and “5 whys” are free templates that pair well with it.
Value stream map mistakes to avoid
- Mapping from memory. People remember how a process should run. Walk it and count the queues.
- Too much at once. Pick one product or request type, with a clear start and end.
- Timing the work and skipping the waits. The waits are usually the point.
- Averages with no source. Note whether a time was measured or estimated.
- Trimming fast steps first. It feels productive and barely moves the lead time.
- Stopping at the current state. A map with no future state is only a description.
FAQ
It shows every step and wait needed to deliver something to a customer, with times, so a team can see where time goes and decide what to change first.