
How to make a data flow diagram
How to make a data flow diagram: the four symbols, context and level 1 views, the rules that catch errors, and how to draw one in FlowDraw.
A flowchart tells you what happens next. A data flow diagram tells you where the information goes: who supplies it, what changes it and where it is kept. Here is how to make a data flow diagram, worked through on a small order system.
Quick AnswerA data flow diagram (DFD) shows how data moves through a system, using four symbols: external entities, processes, data stores and labeled flows. It leaves out timing and decisions. To make one, draw the whole system as a single process, then split that process into numbered parts.
What is a data flow diagram?
A DFD maps information rather than work. It comes from the structured analysis methods of the 1970s, and it still answers questions such as “which parts of this system touch customer records?”
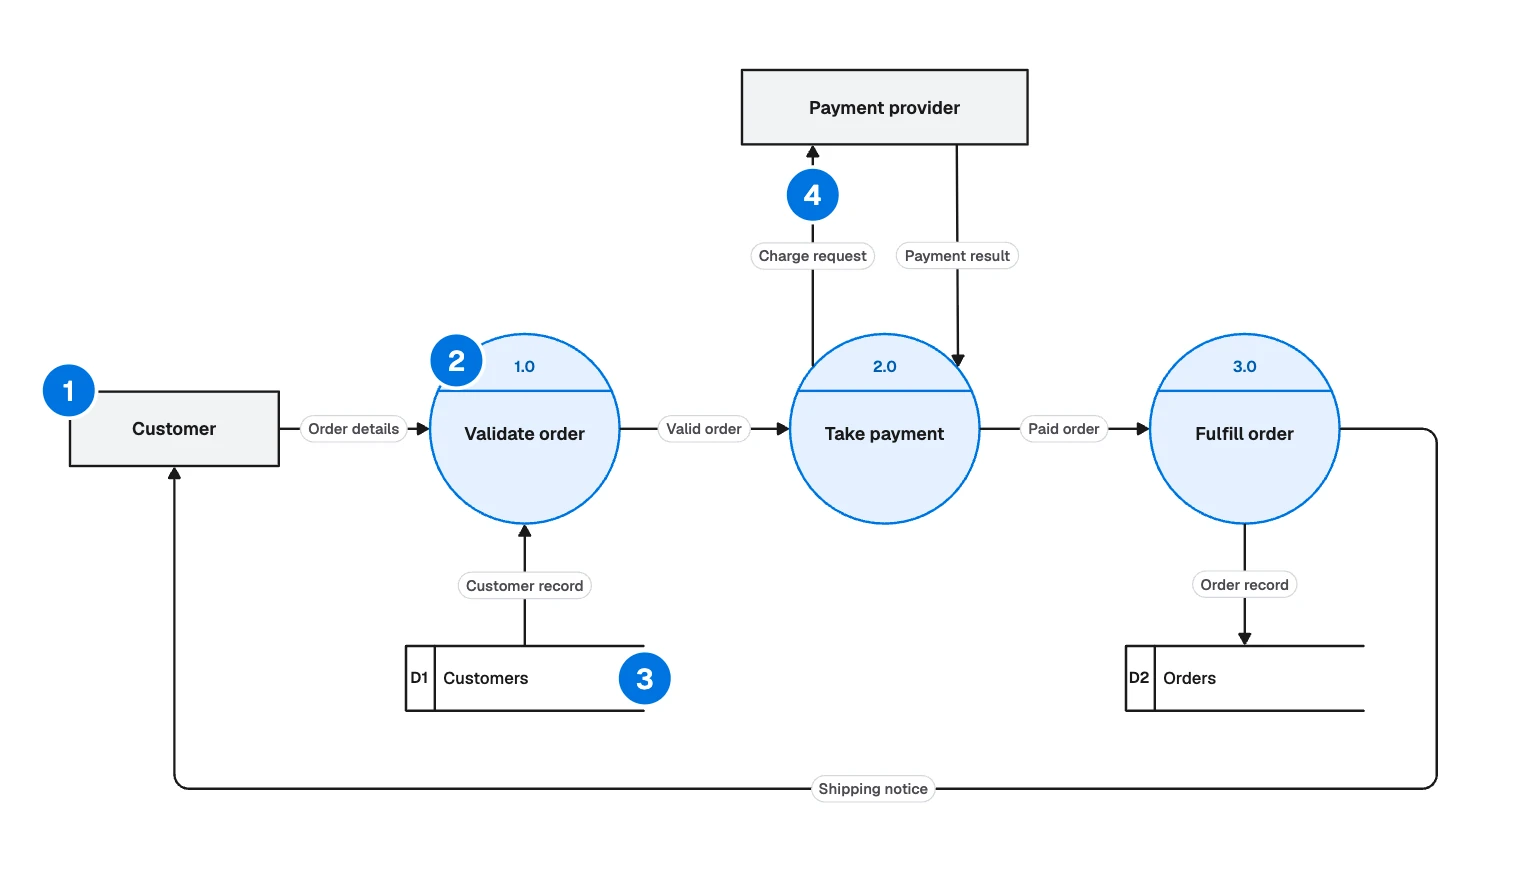
- External entity: a person or system outside your scope. Label it with a noun, such as Customer.
- Process: something that changes data. Use a verb and a noun, such as Validate order.
- Data store: data kept for later. Use a plural noun, such as D1 Customers.
- Data flow: data on the move. Use a noun, such as Charge request.
It helps when you design an integration, hand a system over, or prepare a privacy or security review.
Two notations are common, and they differ mainly in processes and stores:
| Part | Yourdon and DeMarco | Gane and Sarson |
|---|---|---|
| External entity | Rectangle | Square |
| Process | Circle | Rounded rectangle |
| Data store | Two parallel lines | Open-ended box with an ID |
| Data flow | Arrow | Arrow |
The example takes circles from the first and numbered stores from the second. If your team has a house style, keep to it.
Context diagram, level 1 and level 2
A DFD is drawn in levels, and each level opens up a process from the one above.
- Context diagram, or level 0. The whole system is one circle named Order processing, with Customer and Payment provider around it and no stores.
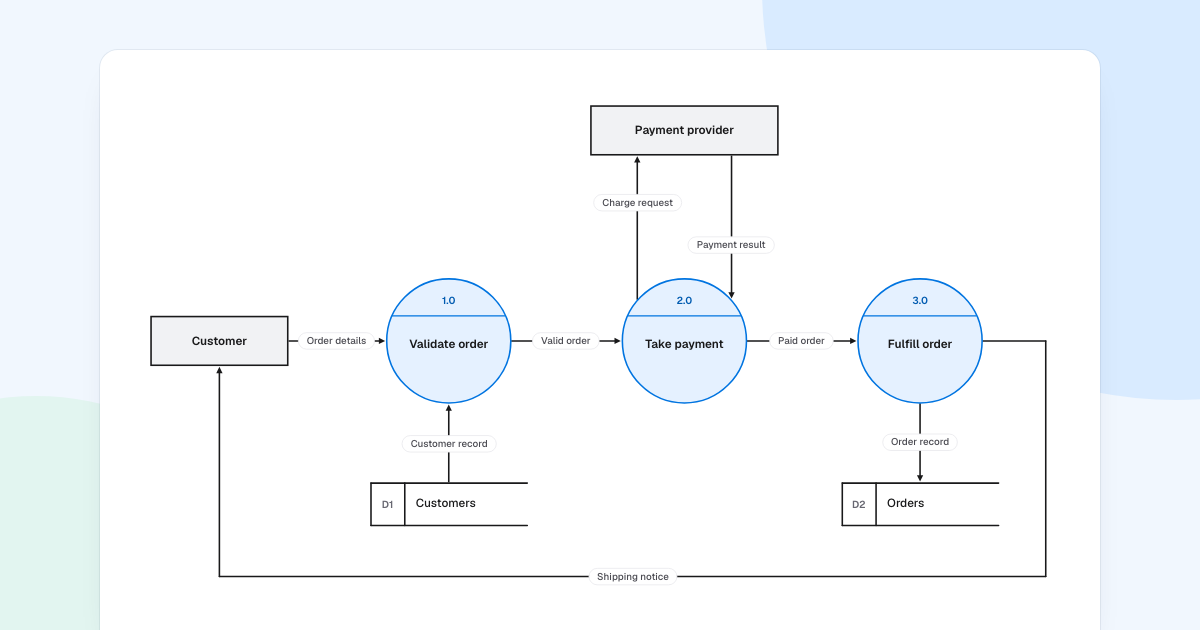
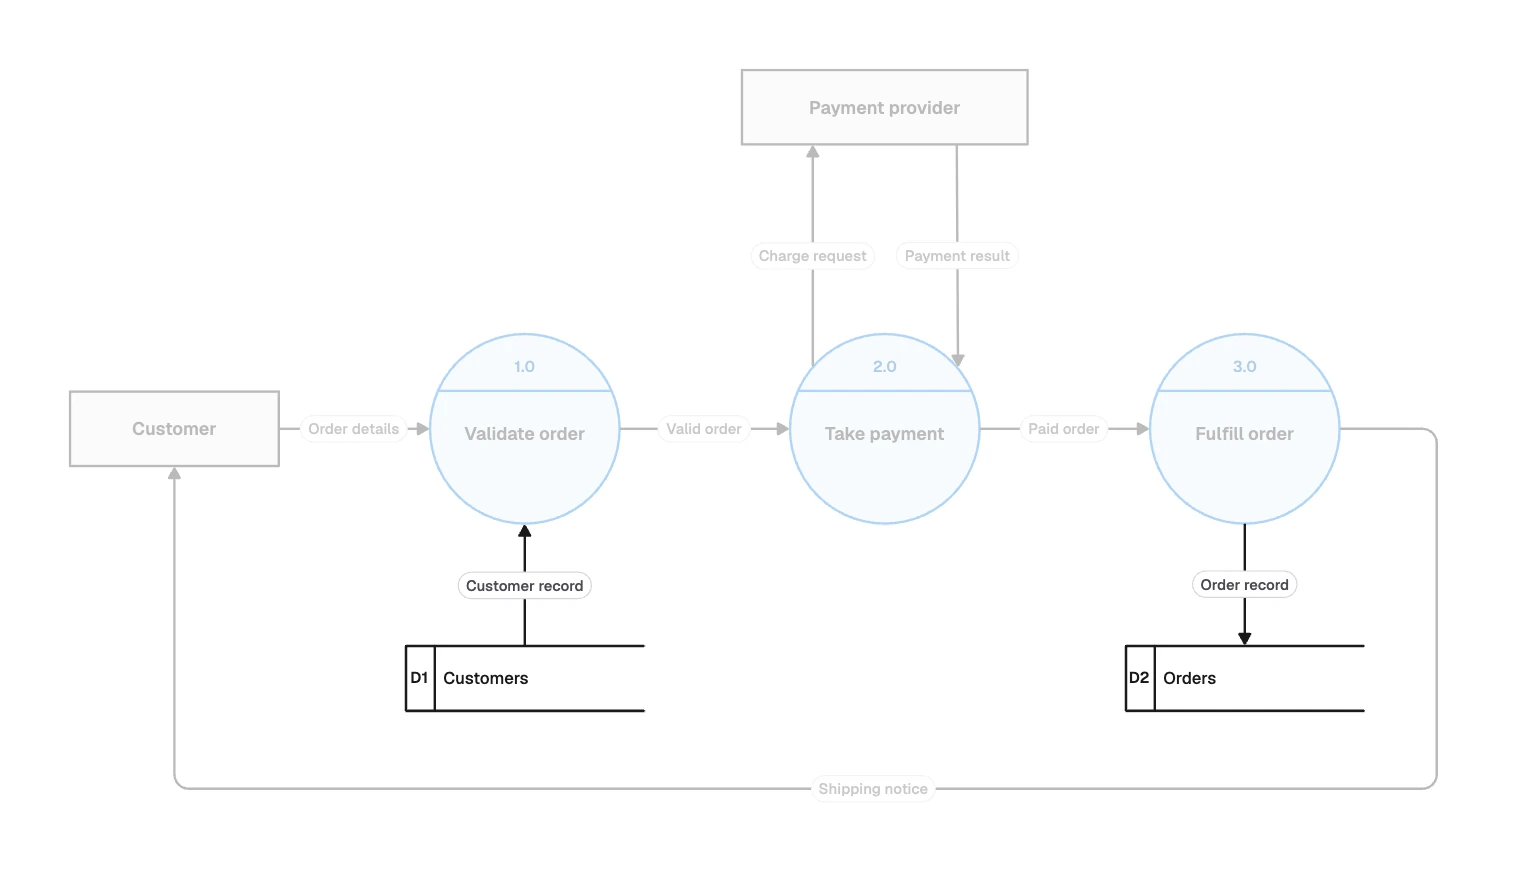
- Level 1. That circle opened into its main processes, and stores appear for the first time. The example here is level 1.
- Level 2. One process opened again, so 2.0 becomes 2.1, 2.2 and so on. Stop when a process does one thing you can describe in a sentence.
Some textbooks call the first split “level 0”. What matters is balancing: the data entering and leaving a process must match its child diagram.
Reading the order processing example
Follow one order through the three processes:
| Process | Takes in | Sends out |
|---|---|---|
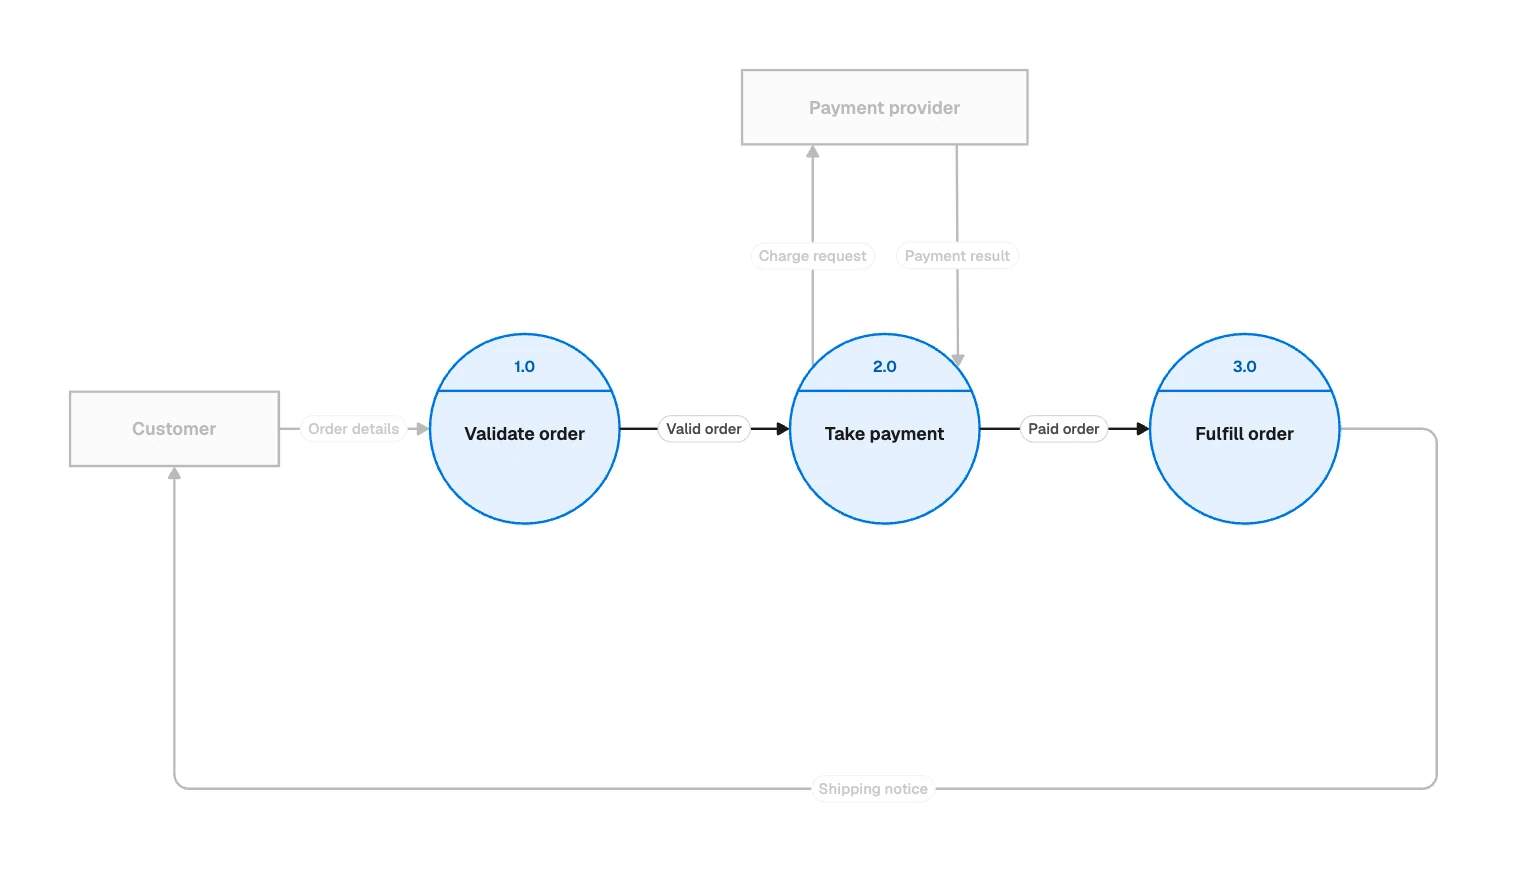
| 1.0 Validate order | Order details, Customer record from D1 | Valid order |
| 2.0 Take payment | Valid order, Payment result | Charge request, Paid order |
| 3.0 Fulfill order | Paid order | Order record to D2, Shipping notice |
Four choices worth copying:
- Every arrow touches a process. Customer never writes to D1 directly, because data only changes inside a process.
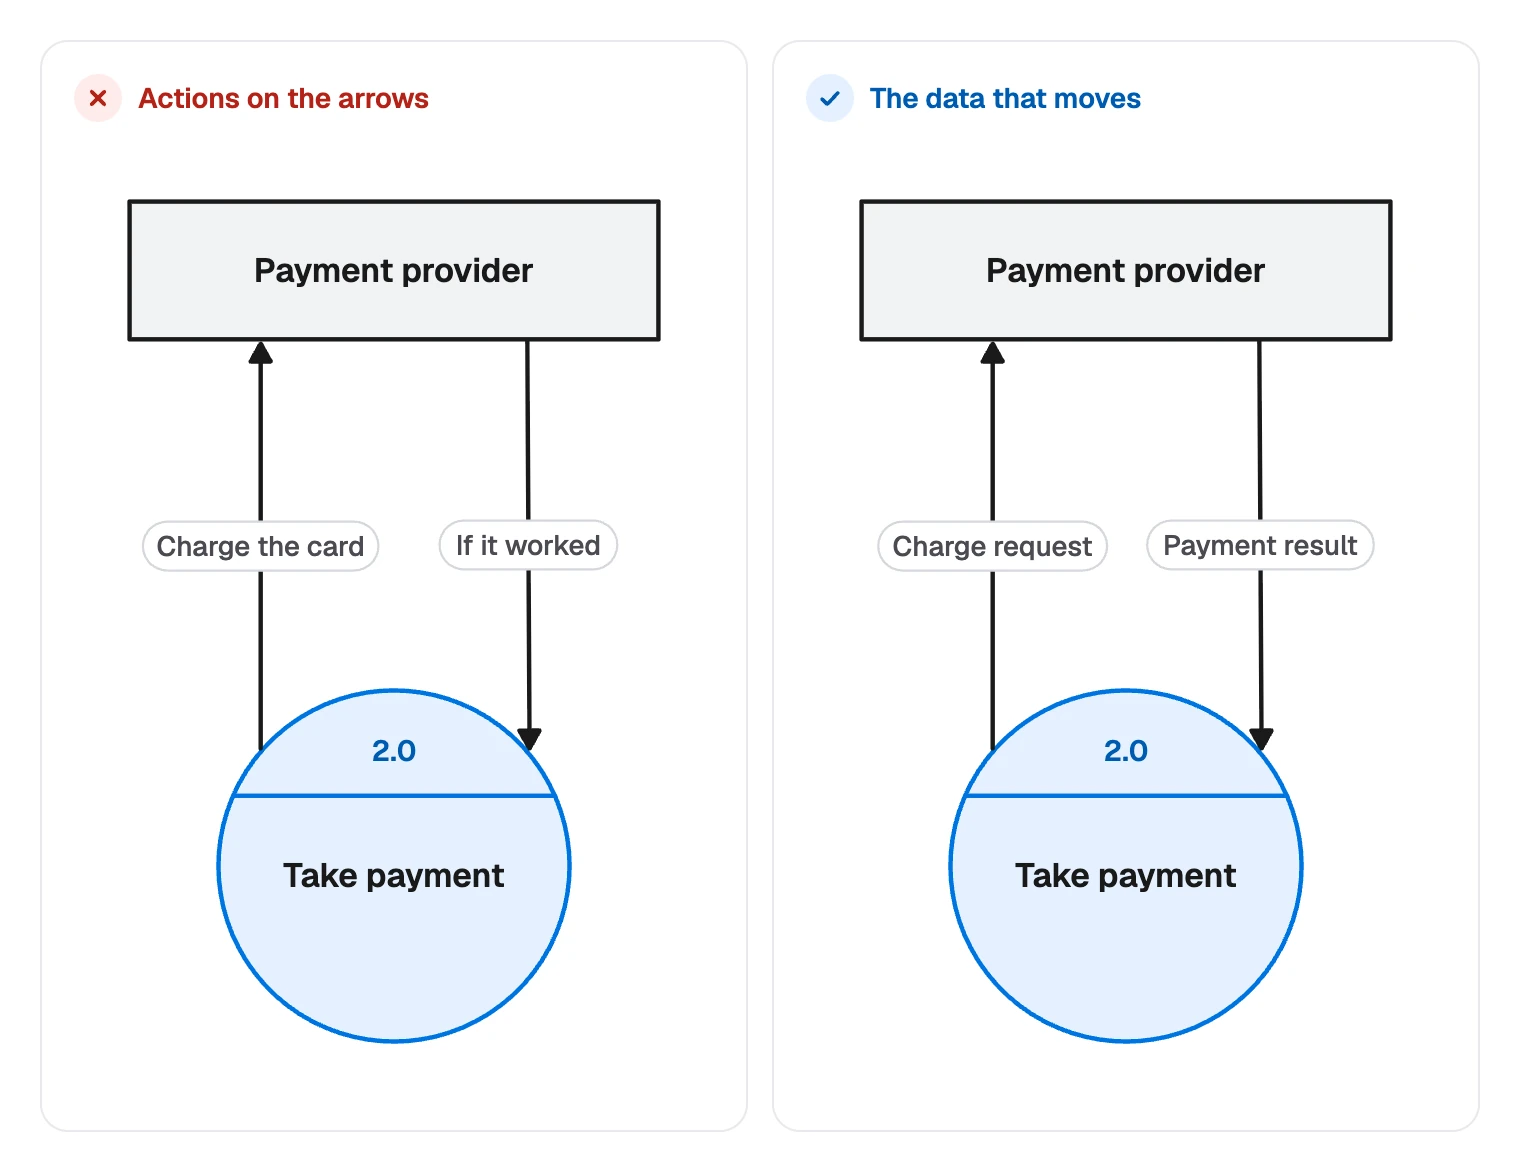
- Labels name data, not actions. A label should say what moves, not what someone does.
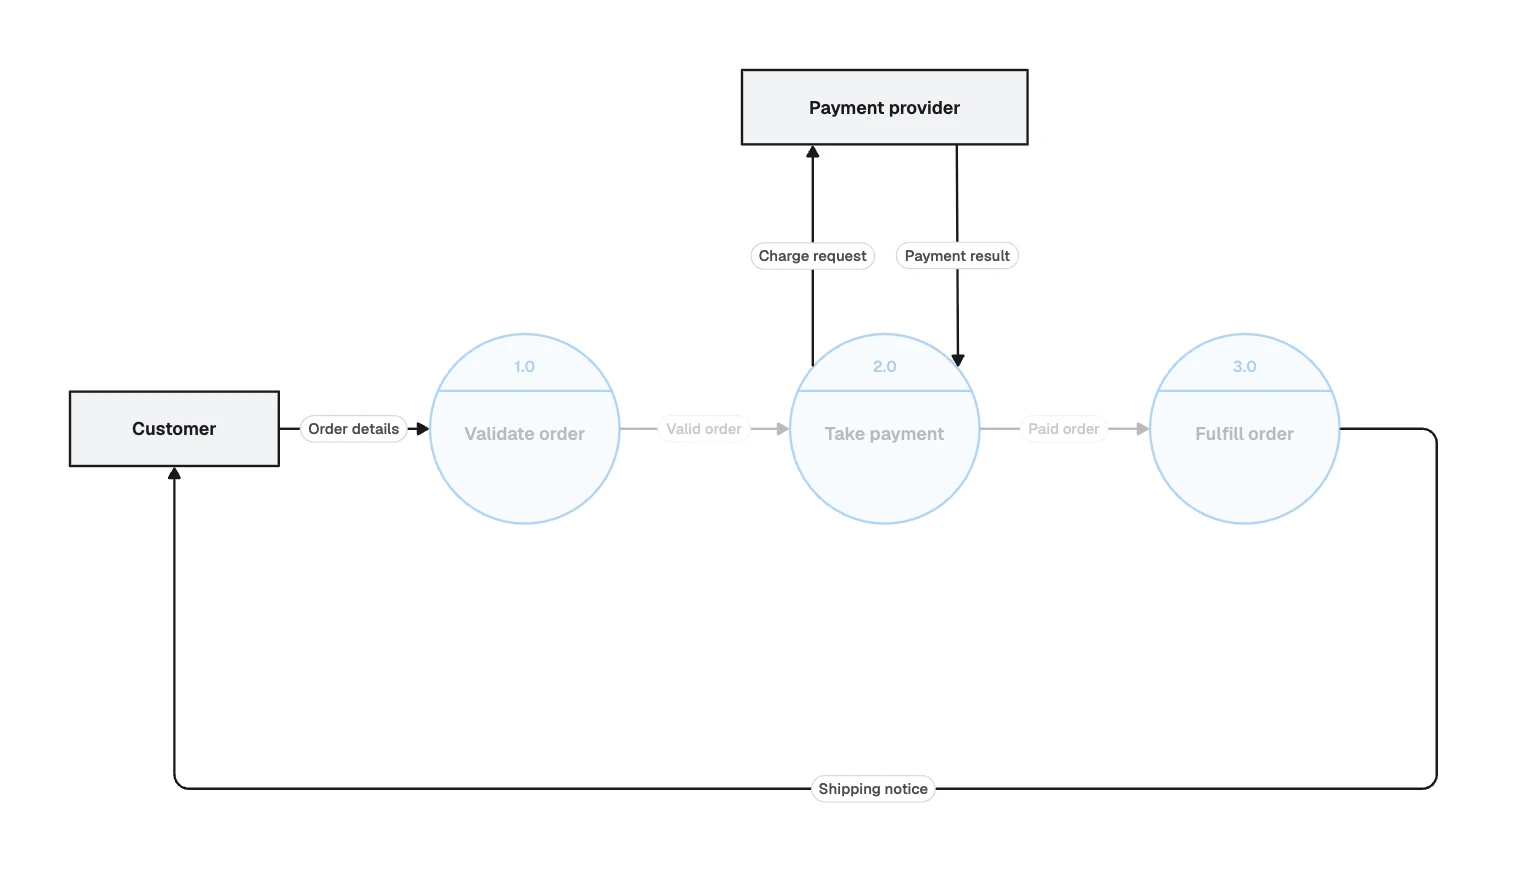
- Request and result get separate arrows. They are different data, and one two-headed line would hide that.
- There is no decision diamond. The sample leaves out rejected orders. A real model would add a flow such as Rejection notice.
When to use a data flow diagram
Reach for one when the question is what data a system takes in, changes, keeps and sends out. Other questions suit other diagrams:
| Your question | Better fit |
|---|---|
| What happens first, and what depends on a yes or no? | A flowchart |
| How are the stored tables structured? | An ER diagram |
| In what order do systems call each other? | A sequence diagram |
| Where does all of this run? | A cloud architecture diagram |
How to make a data flow diagram
- Set the boundary. Write one sentence saying what is inside the system. Everything else is an external entity or out of scope.
- List the data. Note what comes in and goes out: forms, records, messages, files, in the names people already use.
- Draw the context diagram. One process, the external entities and a labeled arrow for each item on your list.
- Split the process. Three to seven parts per diagram is a good range. Number each one and name it with a verb and a noun.
- Add stores. Put one wherever data waits between processes or has to outlive a single run.
- Check the balance. Every flow on the context diagram must appear at level 1.
- Walk it through. Ask someone who knows the system to trace one real record from start to end.
How to make one in FlowDraw
The “Data flow diagram” template and the “Data flow” library need Pro or Team. The pricing page lists what each plan includes.
Open the template
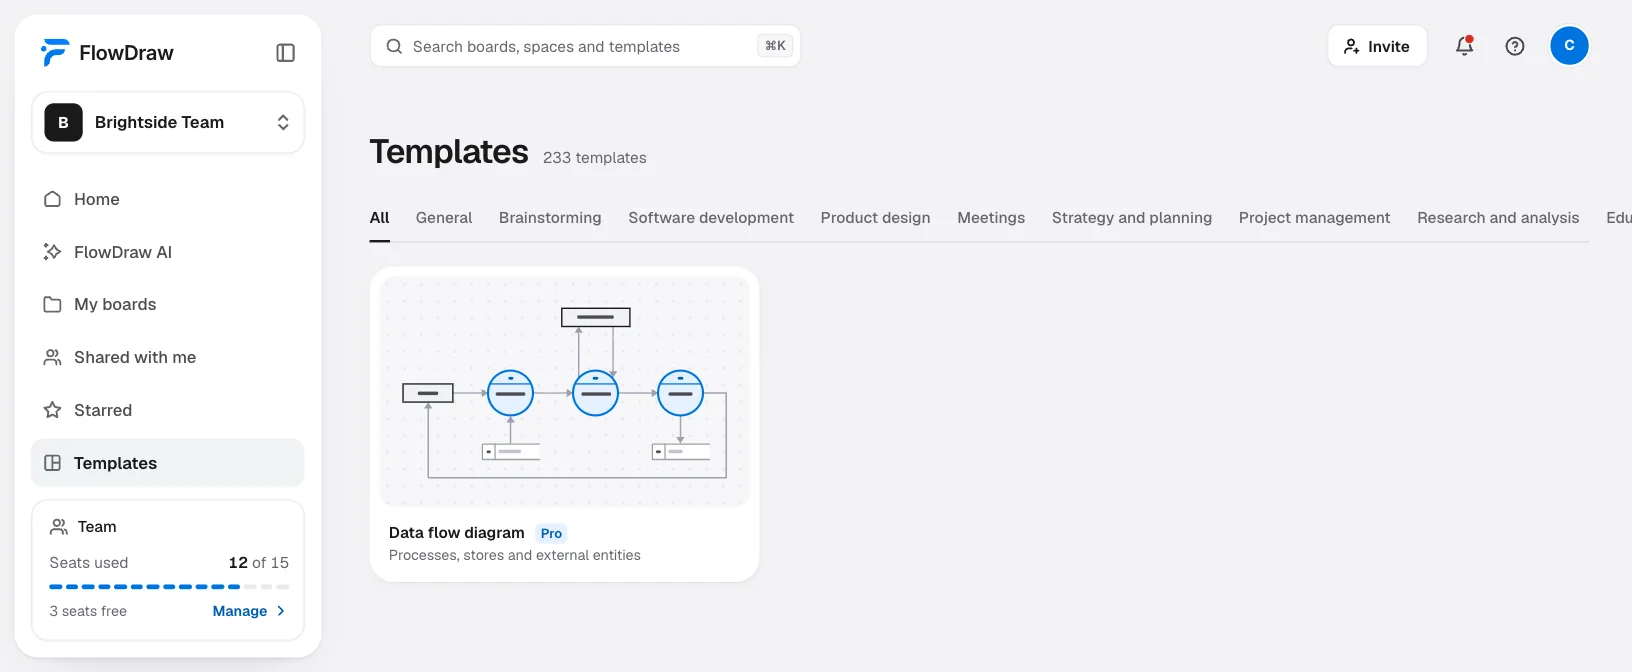
In the sidebar choose “Templates”, search for “Data flow diagram”, open the preview and choose “Use template”.
Replace the names
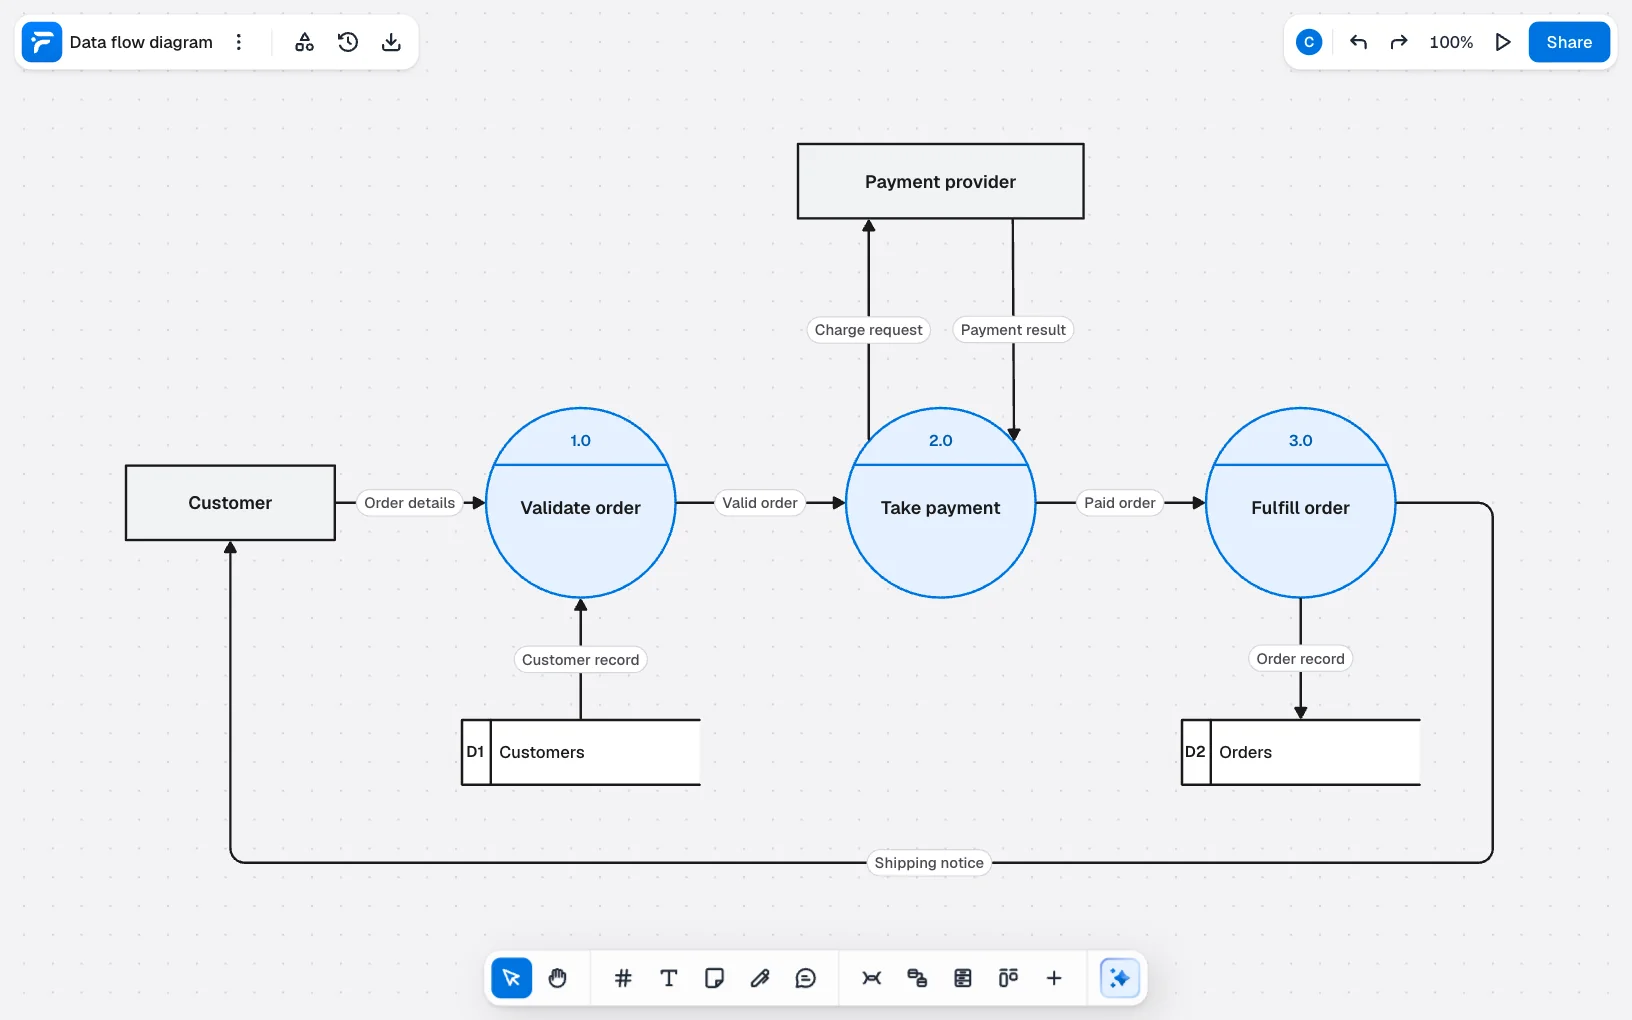
Double-click any label to edit it. Each process number and name is its own text box on the circle, so Shift-click all three and press ⌘G (Ctrl+G on Windows) before you move them.
Add processes and stores
Open “Shape library” in the top bar, find “Data flow”, then drag “Process”, “External entity” or “Data store” onto the board.
Connect and label
Hover a shape and drag from the spot beside it to another shape, or press L with nothing selected. Select the line to open “Line properties” and type the data’s name in “Add a label”.
Give each level a frame
Press F and draw a frame around each level. Frames are the slides of “Present” and the pages of “Export”.
To start from nothing, choose “Blank board” on Home and drag shapes in from the same library.
On Free you can use “Circle” and “Rectangle” from “Basic shapes”, and “Database” from “Flowchart” for a store. They are not strict DFD symbols, but a labeled diagram reads the same and fits inside Free’s 150 elements per board.
Common data flow diagram mistakes
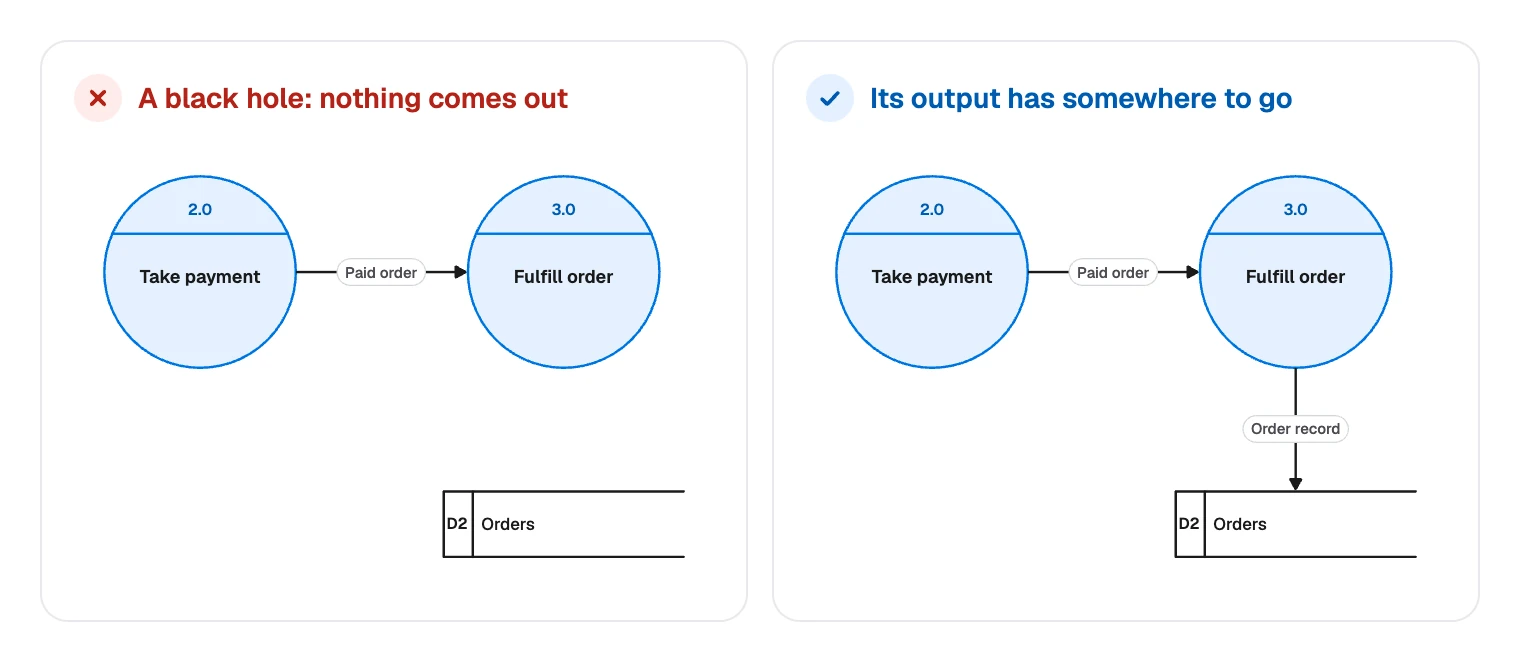
- Black holes and miracles. A process with inputs but no output swallows data. One with outputs but no input makes data from nothing. Either way, a flow is missing.
- Arrows that skip a process. Entity to store, store to store and entity to entity are all wrong. Add the process that does the work.
- Control flow on the arrows. Words like “if valid” or “then” mean you have drifted into a flowchart. Keep only the data here.
- Unlabeled arrows. If you cannot name what moves along a line, you do not yet know what moves.
- Levels that drift apart. A new flow added at level 2 has to appear on its parent too, or the two diagrams stop agreeing.
FAQ
External entities send or receive data. Processes change it. Data stores keep it for later. Data flows are the labeled arrows between them.