
How to make an empathy map
Learn how to make an empathy map: pick one user and one moment, fill in says, thinks, does and feels, name pains and gains and turn them into next steps.
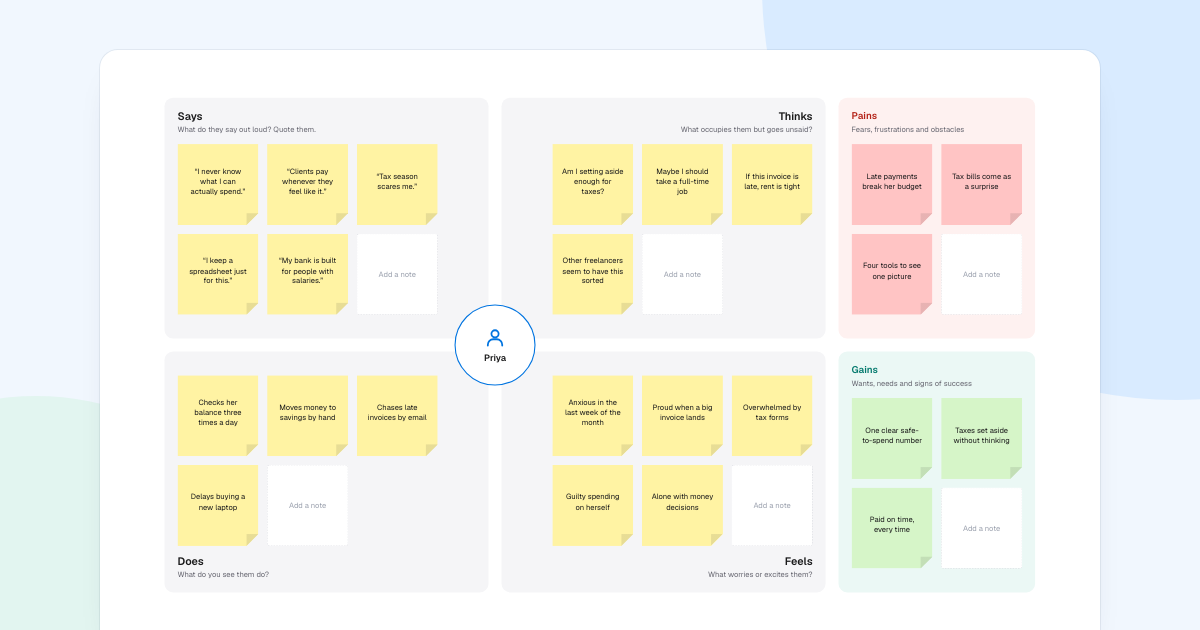
Teams often talk about “the user” as if they had all met the same person. An empathy map fixes that in one sitting: one person, one moment, on one page. This guide uses Priya, a freelance designer working out what she can spend.
Quick AnswerAn empathy map captures what one user says, thinks, does and feels in one moment. To make one, pick the person and the moment, fill the four quadrants from research, name their pains and gains, then look for gaps between what they say and what they do.
What is an empathy map?
It is a shared summary of research, with the person in the middle. Dave Gray developed it at his company XPLANE.
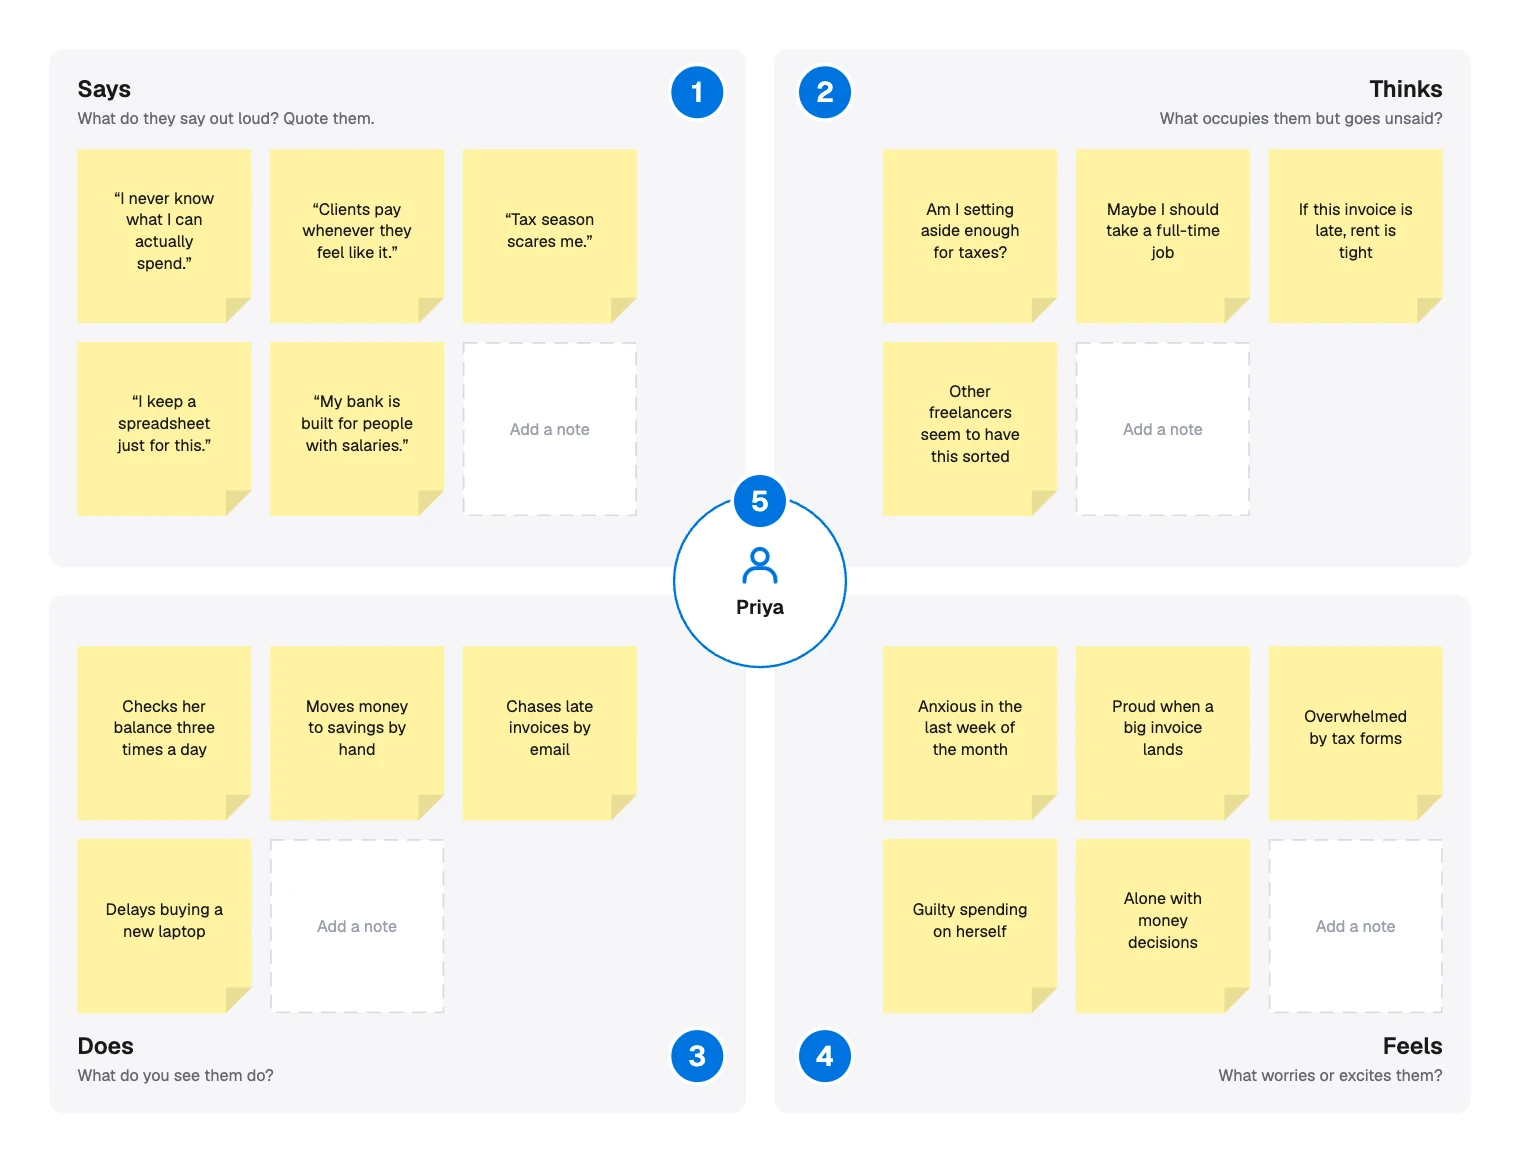
| Pin | Quadrant | What goes in it | Where it comes from |
|---|---|---|---|
| 1 | Says | Their words, quoted | Interviews, tickets, reviews |
| 2 | Thinks | What occupies them but goes unsaid | Your reading of the research |
| 3 | Does | What you see them do | Observation, diary studies |
| 4 | Feels | What worries or excites them | Your reading of the research |
| 5 | The user | One named person | Your recruiting |
Use one after research and before ideas, when the notes are too long for anyone to read. It does not replace research. With nothing to draw on, you are only writing down what the team already assumes.
How to make an empathy map
Pick one user and one moment
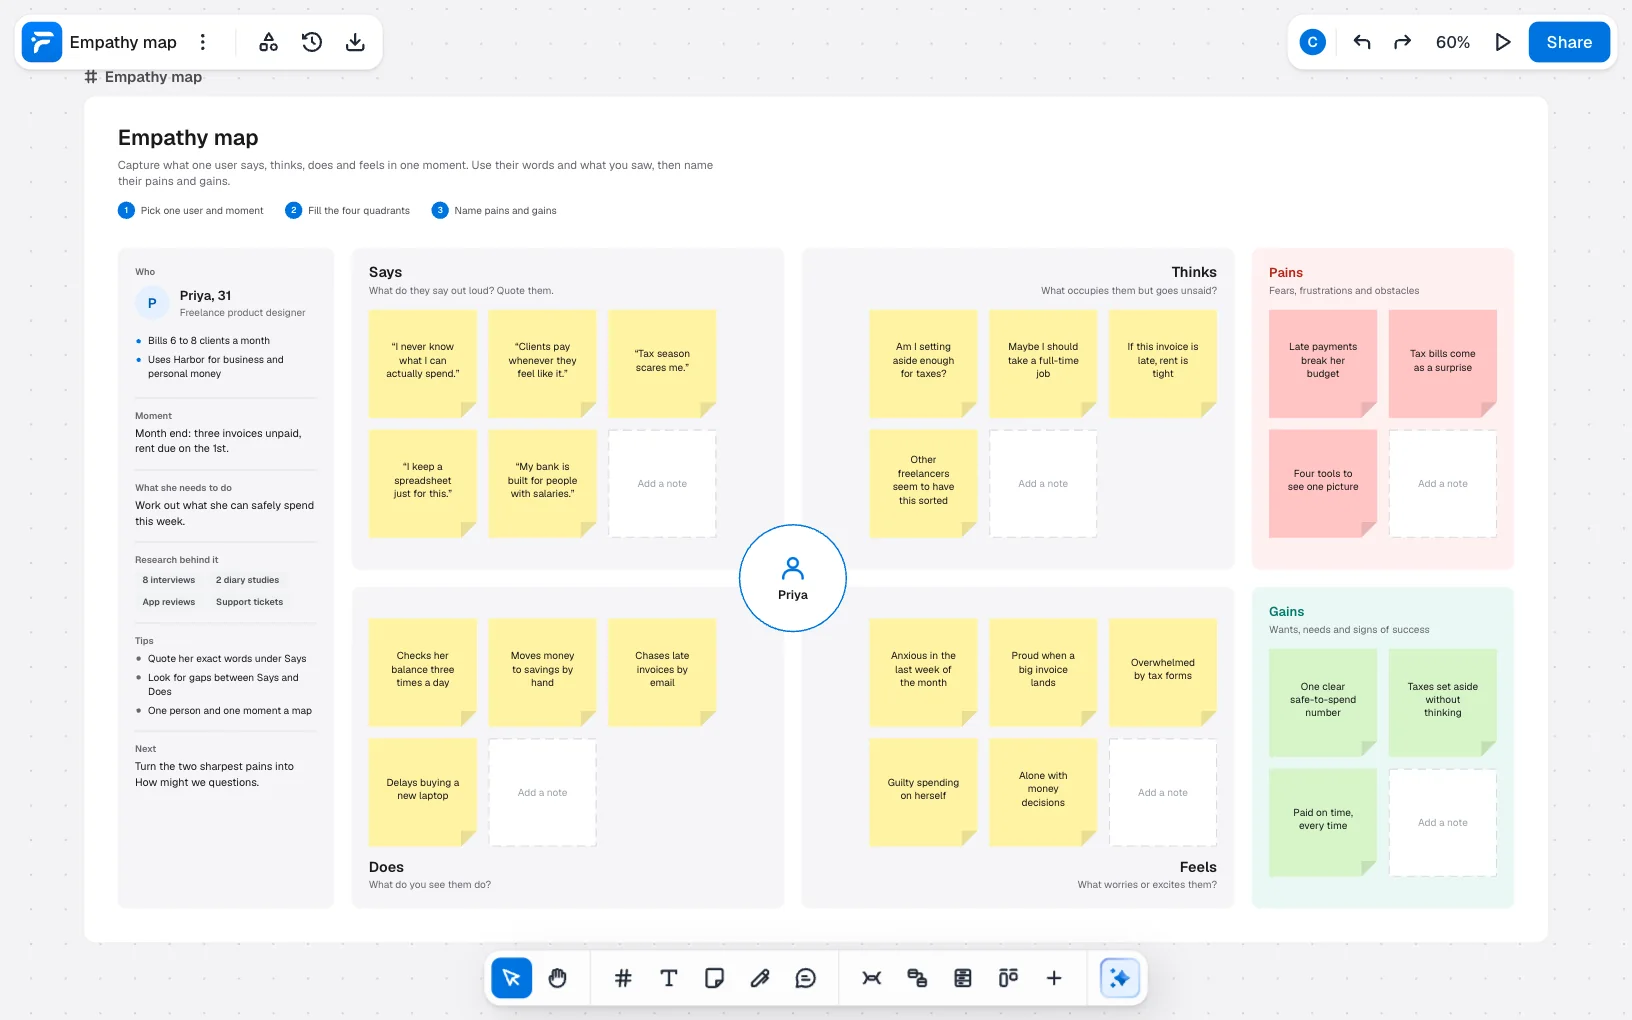
“Freelancers and money” is too wide to fill in honestly. Priya at month end is not: three invoices unpaid, rent due on the 1st.
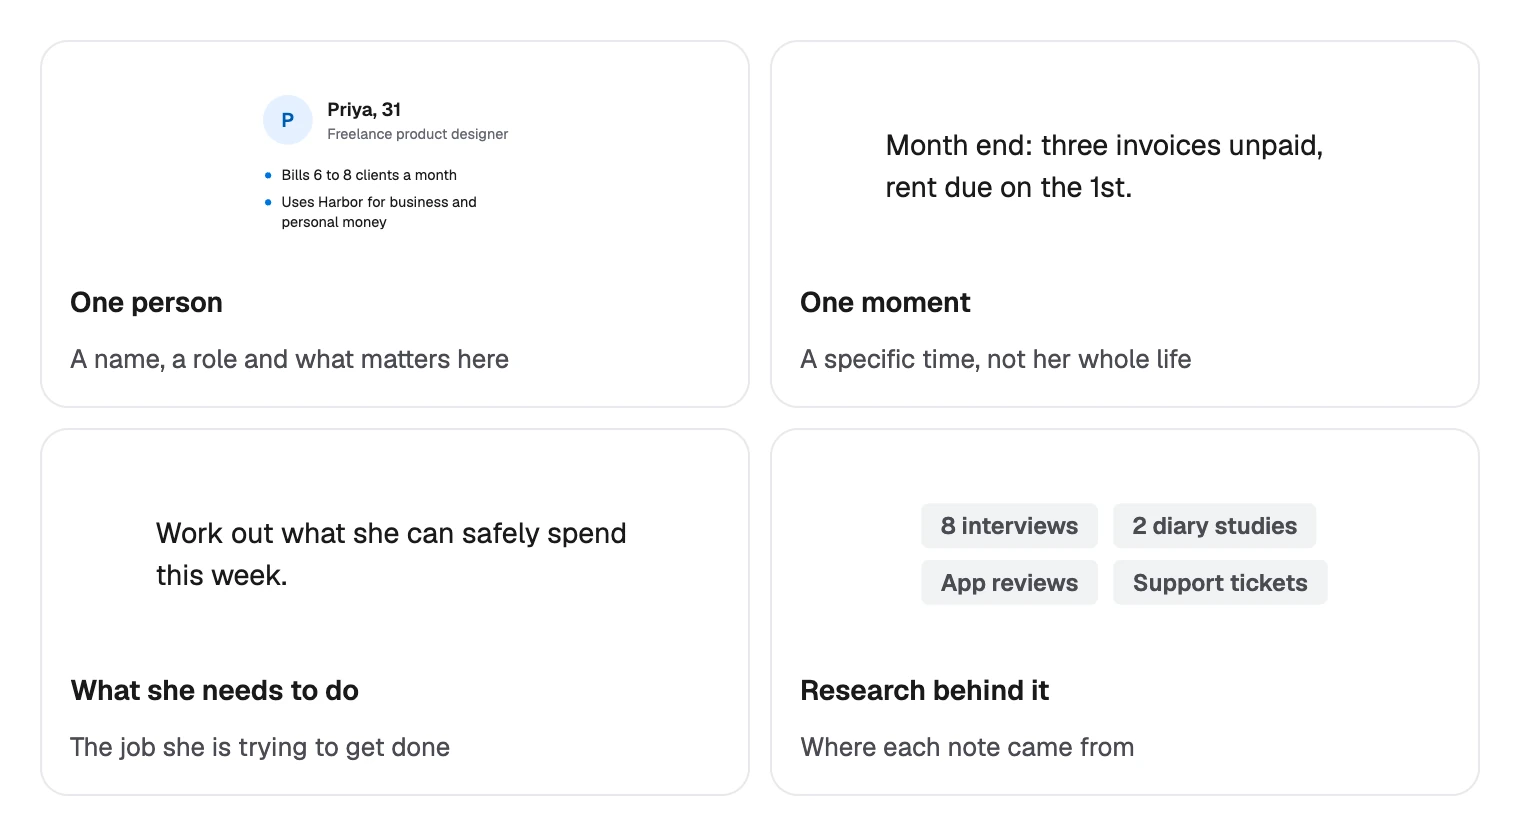
Write the research behind it on the board too. Here it is 8 interviews, 2 diary studies, app reviews and support tickets, so anyone can ask where a note came from.
Fill in Says and Thinks
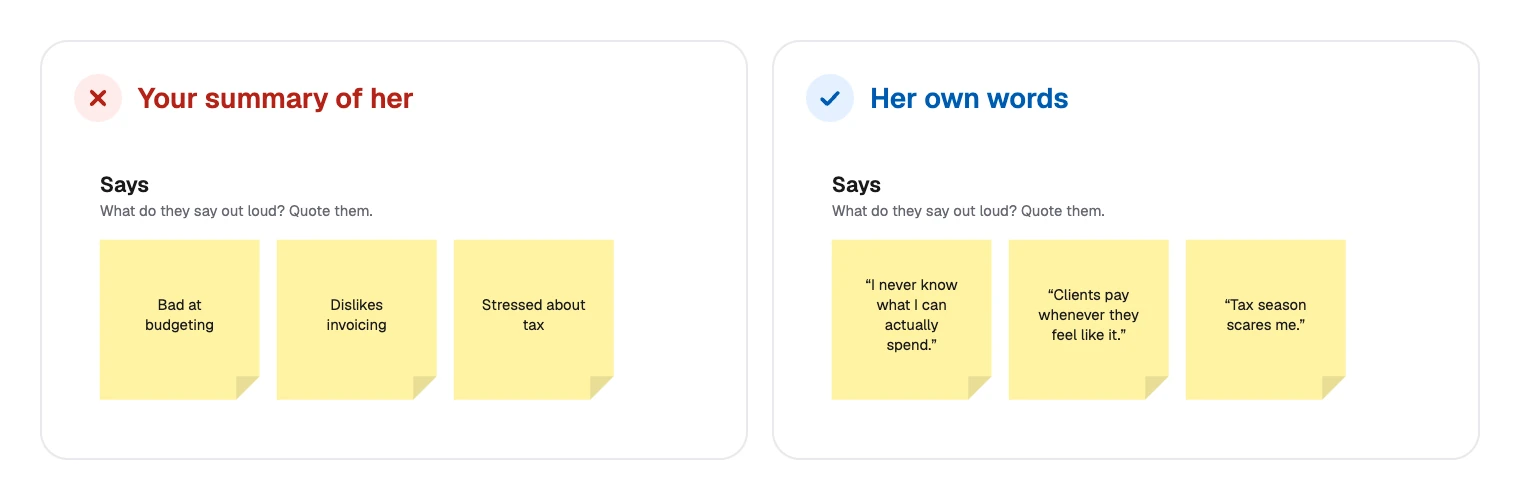
Start with Says, because it is the easiest to check. Copy exact words and keep the quotation marks.
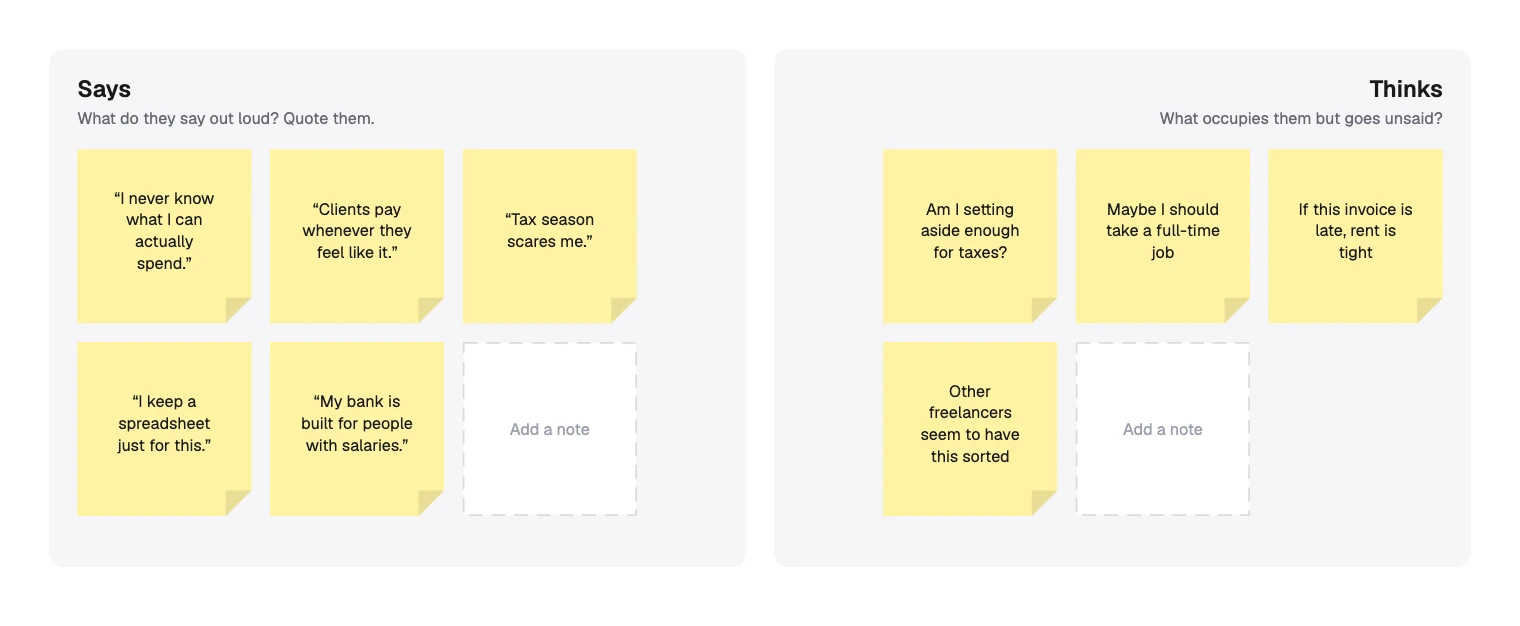
Thinks is your inference. Priya may never tell an interviewer “Maybe I should take a full-time job”, so a note like that should trace back to something you heard or saw.
A summary is not a quote, and it often slips in a judgement:
Fill in Does and Feels
Does holds what you could film: “Checks her balance three times a day”. Feels names the emotion and, where you can, when it comes.
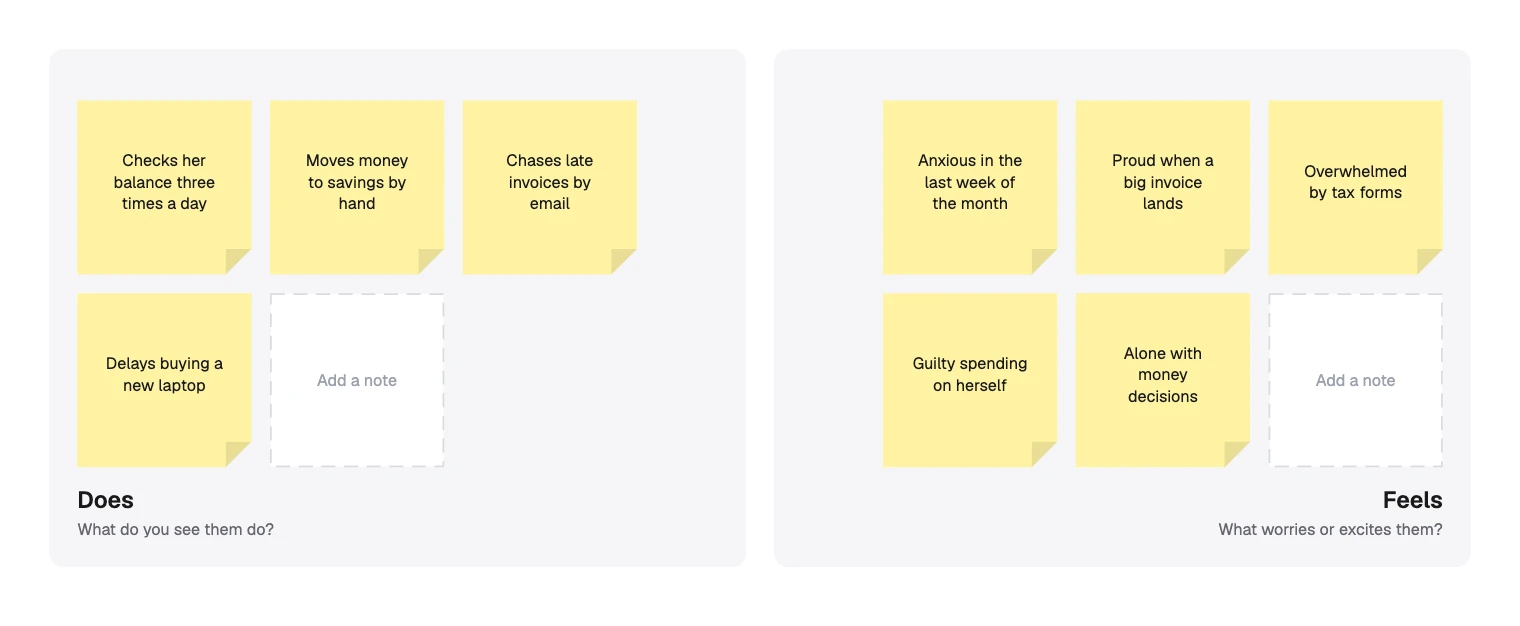
“Anxious” says little. “Anxious in the last week of the month” tells you when to help. Include good feelings as well, since “Proud when a big invoice lands” is worth protecting.
Name the pains and gains
Now step back from the quadrants and sum up. Pains are fears, frustrations and obstacles. Gains are wants, needs and signs of success.
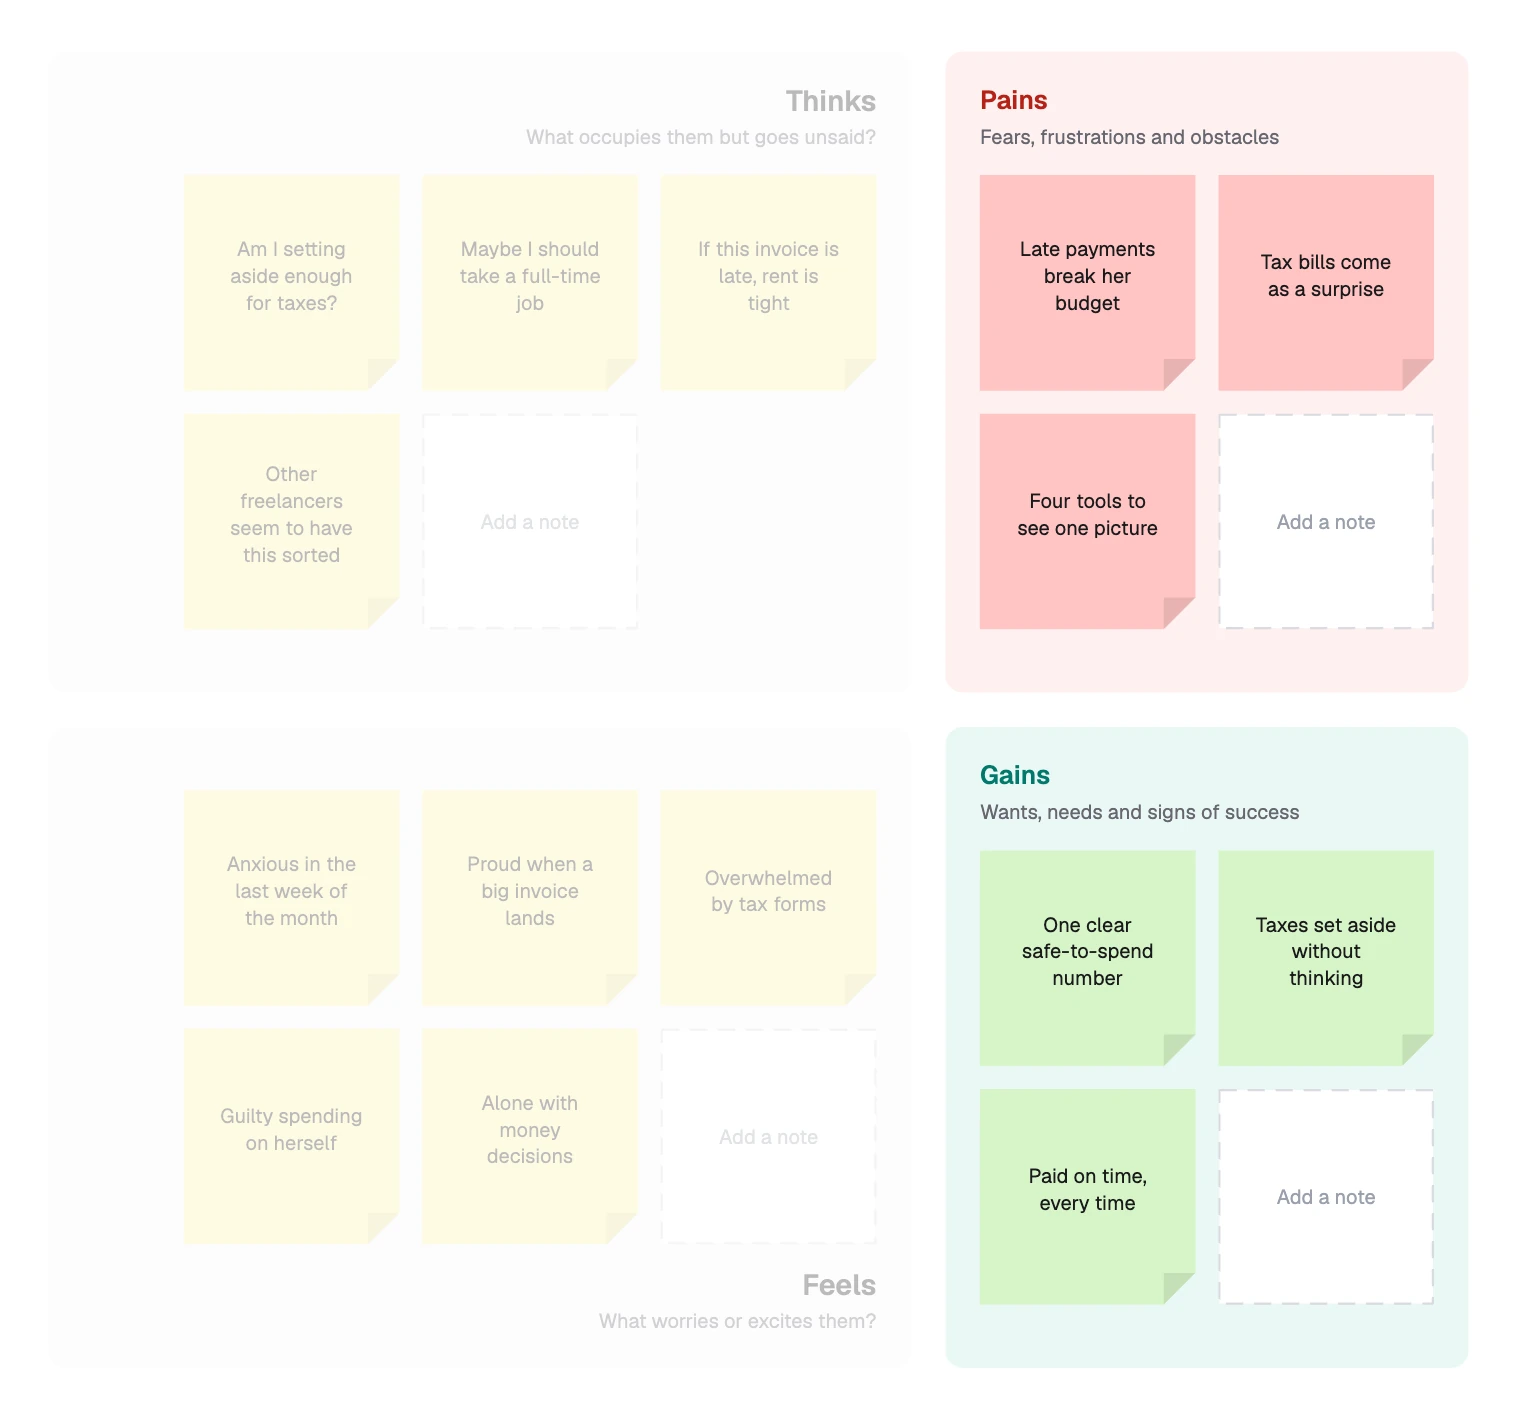
Each one should have evidence in a quadrant. “Tax bills come as a surprise” rests on “Tax season scares me” and “Am I setting aside enough for taxes?“.
Read the gaps and decide what next
The useful part is often where the quadrants disagree:
- Says against Does. She says “I keep a spreadsheet just for this”, yet she checks her balance three times a day. The spreadsheet may not answer her question.
- Says against Feels. She sounds practical about clients paying late, and still feels “Alone with money decisions”.
- Empty panels. A thin Does panel usually means you interviewed people and never watched them.
Then turn the two sharpest pains into questions, as the board suggests: “How might we stop tax bills coming as a surprise?” and “How might we keep late payments from breaking her budget?“.
Making an empathy map in FlowDraw
The template is free on every plan, and everything on it is sticky notes, shapes and text.
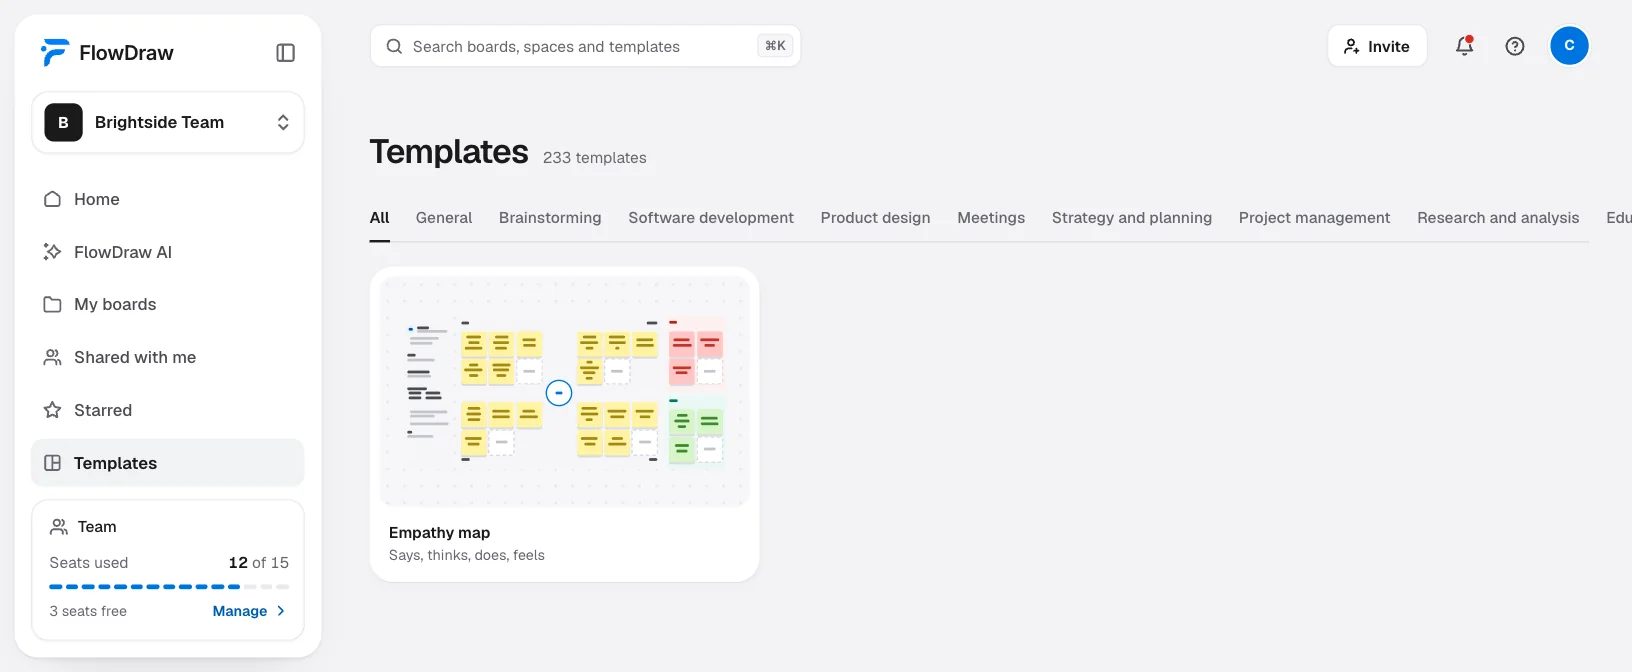
Open the template
Search for “Empathy map” under “Templates”, open the card, then choose “Use template”.
Swap in your user
Double-click Priya’s name, her moment and each research tag, then type. Press Esc to finish.
Replace the notes
Double-click a sticky note and type over it. Keep one line of evidence per note.
Fill an “Add a note” box
These dashed boxes are plain rectangles, not sticky notes. Delete the box, select a note beside it, press ⌘D (Ctrl+D on Windows) and drag the copy into the gap. It keeps its colour.
Add a note anywhere
Press Esc, then N, pick a colour and click the board. Drag the note, and a dashed guide appears when it lines up with its neighbours.
Run it as a group
Choose “Share” and add people. They can add notes at the same time, and you see their cursors. On Free everyone you invite can edit. On Pro only one person can, so others press C and comment.
Pick the sharpest pains
FlowDraw has no voting or timers, so agree aloud. “How might we” is a free template for the next step.
From here, a user journey map follows the same person across stages, and a wireframe puts what you learned into a page.
Empathy map mistakes to avoid
- Several users on one map. Averages describe nobody. Make one map per person or type.
- No moment. Without one, the map turns into a general biography.
- Guessing from the meeting room. Mark what has no evidence, then go and check it.
- Filling every panel evenly. A thin panel tells you what your research missed.
- Solutions in the notes. “Needs a budgeting app” is an idea. Write the pain instead.
- Finishing at the map. It is a step toward a decision, so end with the next questions.
FAQ
It gathers what a team knows about one user in one place, so people share the same picture before they decide what to build. It also shows where the team knows little.