
Diagram as code or drag and drop: how to choose
Diagram as code or drag and drop? See when Mermaid or PlantUML is the better choice, when a canvas wins, and how to decide for each diagram you keep.
We build a canvas tool, so you know our bias. Even so, some diagrams belong in a text file next to your code, and the choice between diagram as code and drag and drop gets easier when you look at one diagram at a time.
Quick AnswerChoose diagram as code when a diagram lives beside code, changes through pull requests or is generated from another source. Choose a drag and drop canvas when layout carries meaning, when the people editing it do not write code, or when it is drawn live in a workshop. Decide per diagram, not per team.
When diagram as code is the better choice
Mermaid and PlantUML turn a text description into a picture. You write a line like Browser -> API: POST /token and the tool draws the arrow. Because the source is text, three things follow.
Changes can be read. A pull request shows the changed line. A reviewer sees that “Retry payment” became “Refund payment” without comparing two images.
The diagram ships with the code. An API change and its sequence diagram go in the same commit, and a reviewer can ask for the update before merging. GitHub renders Mermaid in Markdown files, so the picture appears in the README with no extra step.
A script can write it. If a diagram can be derived from your migrations or your service list, let a build step produce the text on every merge. Nobody should spend an afternoon dragging boxes to show what a script already knows.
We would push back on one common claim: text does not stay current by itself. A Mermaid block goes stale as easily as a board when nobody is required to touch it. What text gives you is a cheaper fix, and a place in review where someone can ask for one.
When drag and drop is the better choice
A text tool hands layout to an engine. For a sequence diagram that is fine, because order is the whole layout. For an architecture overview it can turn into a fight. You want the outside systems around the edge and the payment path running left to right, so you start reordering lines and adding hidden links to coax boxes into place. On a canvas you drag the box.
Position carries more meaning than code-first teams tend to admit. What sits in the middle, what is grouped and what is far away all tell the reader something.
The bigger reason is who edits. Say Lisa runs support and owns the refund process. When a step changes, she should be able to fix it that afternoon. If that means learning a syntax and opening a pull request, she will ask an engineer, the engineer will get to it next sprint, and the diagram stops being hers.
Workshops are the other clear case. Six people working through an incident think by writing notes, moving them and drawing arrows while they talk, and a syntax error helps nobody in that hour. A canvas also lets reviewers outside engineering point at the step they mean, where a diff would ask them to read the source first. Whether a session like that wants a whiteboard or a diagram tool is a separate question.
How to choose, diagram by diagram
A team-wide rule is the usual mistake. “Everything in Mermaid” shuts out support and product. “Everything on a board” loses the diagrams that should be reviewed with the code. Ask these questions in order, and stop at the first yes.
- Can a script produce it? Generate it as text.
- Must it change in the same commit as the code? Keep it as text in the repo.
- Will people who do not write code edit it? Use a canvas.
- Does placement matter, or will it be drawn live? Use a canvas.
If you reach the end with no yes, either works, so pick the one your team will open again. Here is how that plays out.
| Diagram | Home | Why |
|---|---|---|
| OAuth sign-in sequence in your API docs | Text | Order is the layout, and it should change with the code |
| Database schema rebuilt from migrations | Text, generated | A script knows it better than you do |
| Order state machine enforced in code | Text | Reviewed with the code that enforces it |
| Refund process across support and billing | Canvas | Non-engineers own it, and the lanes matter |
| System overview for a leadership review | Canvas | Placement tells the story |
| Incident timeline from a postmortem workshop | Canvas | Drawn live by several people |
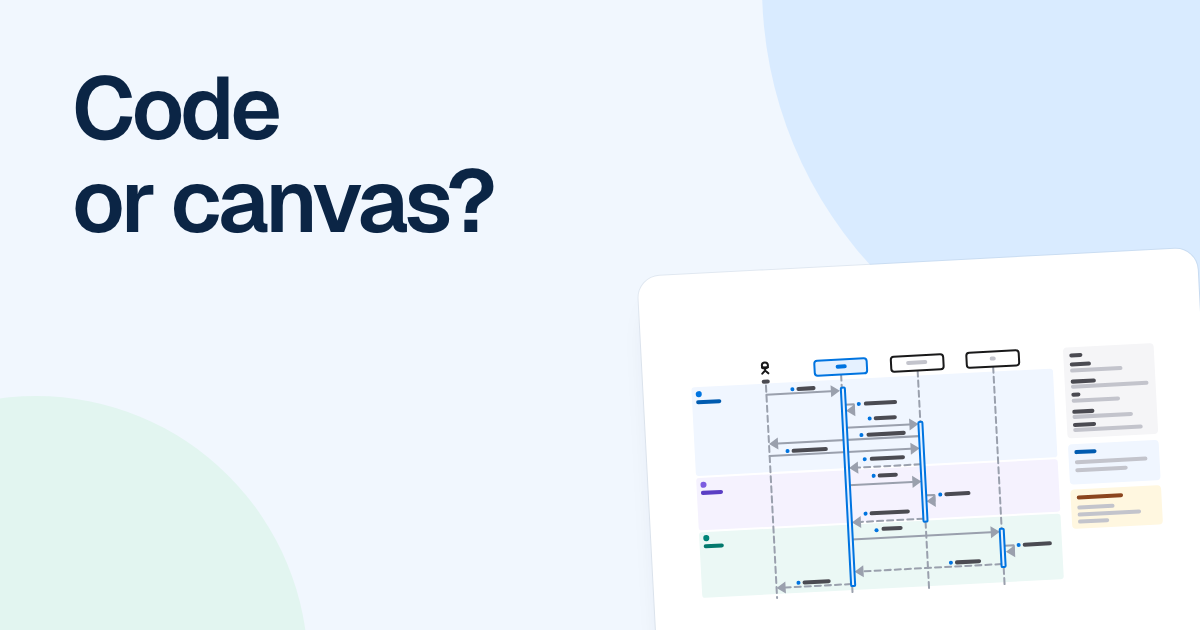
The picture on this post is FlowDraw’s “OAuth 2.0 sequence” template. It is a good way to teach the flow to a new hire. For the sequence your own code implements, we would still keep the source in the repo.
Where FlowDraw stands
FlowDraw is a canvas. It does not import Mermaid or PlantUML, and it has no public API that a script could use to write boards. If your diagrams need to live in a repo, change in pull requests or be generated in a build, use a text tool. You can save a board’s JSON export in a repo and import it again, but it records shapes and positions, so nobody will review that diff by reading it.
Some people reach for text because typing is faster than dragging, not because they want version control. If that is you, a text tool may be more than you need. FlowDraw AI takes a plain description and draws a board of ordinary shapes, which you can then move and edit.
Most teams end up with both. Keep sequence and schema diagrams in the repo. Keep cross-team processes and overview pictures on a board, and embed them in your docs if your docs allow it. An embed opens without an account and shows the board as it is when the page loads, so a later edit reaches the docs without anyone pasting a new image.
FAQ
Diagram as code means writing a diagram as text, in a language such as Mermaid or PlantUML, and letting a tool draw it. The text can live in version control, so changes show up as readable diffs and can be reviewed like code.