
Handoffs hide the delays: what swimlanes reveal
Handoffs hide most process delays. See how a swimlane makes each crossing visible, using a refund process, and what to do about the waiting you find.
When a refund takes a week, nobody spent a week on it. The request spent most of that time sitting between two people, in a place the usual flowchart doesn’t show.
Quick AnswerMost of the waiting in a process sits between people, not inside tasks. A swimlane shows each handoff as an arrow crossing a lane line, so every crossing becomes a place to ask how long work sits there and who would notice. Then remove the worst crossings or make them cleaner.
Why handoffs hide delays on a flowchart
A flowchart puts “Review request” and “Refund in Stripe” next to each other with a short arrow between them. An arrow has no length in time, so the two look one moment apart. Anyone reading it would guess the whole thing takes an afternoon.
Both tasks are quick. The time goes in the gap: someone has to notice the work has arrived, understand it and get around to it, while the person who sent it assumes it is moving. Value stream mapping, from lean manufacturing, has separated working time from waiting time for decades for this reason. You don’t need the full method to start, because a swimlane already shows you where to look.
What a swimlane shows in a refund process
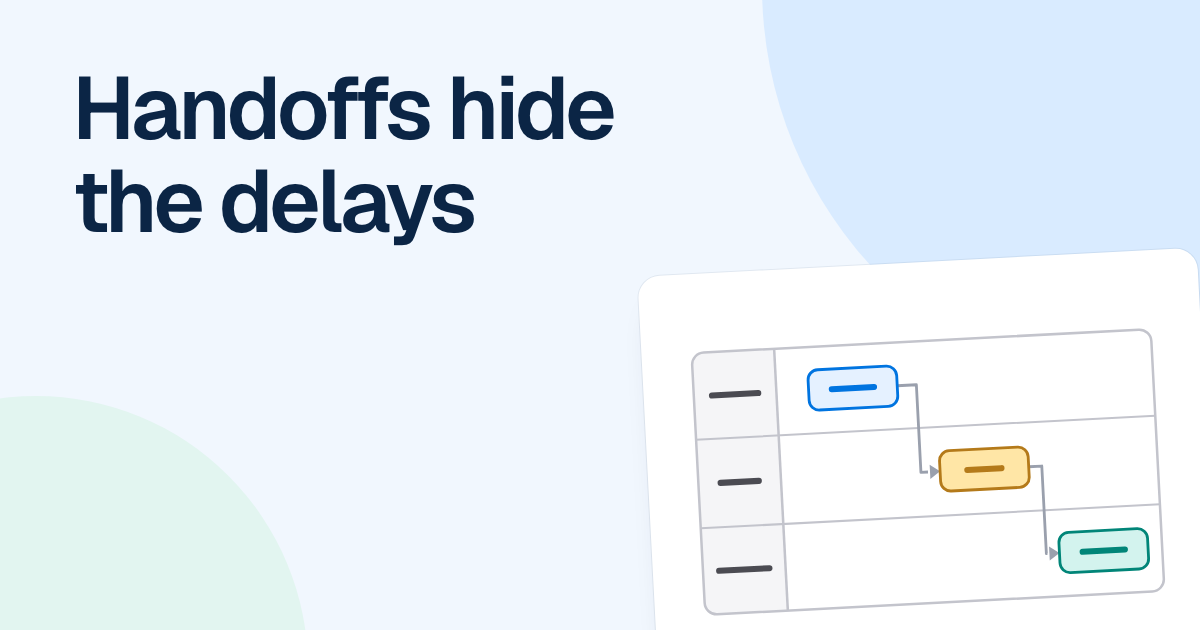
Draw the refund process as a swimlane with three lanes: customer, support and billing. For illustration, say Lisa Carter runs support and Mark Evans runs billing.
The customer requests a refund. Lisa reviews the request and decides whether it is eligible. If it isn’t, she explains the decision. If it is, it goes to Mark, who makes the refund in Stripe and sends the receipt, and the customer gets an email.
In a plain flowchart, that is seven tidy shapes. In lanes, you can count the arrows that cross a line, and each crossing is a wait.
| Crossing | Where the work sits | What to ask |
|---|---|---|
| Customer to support | The help desk queue | How long until someone reads it? Does the customer know it arrived? |
| Support to billing | A shared inbox or a ticket | Who watches it? Does billing work through it daily or in batches? |
| Billing back to support | Lisa’s queue, with a question attached | How often does a request bounce back, and what is missing when it does? |
| Billing to customer | The email, after all of the above | Does anyone update the customer while the request waits? |
The third row is the one people leave out, because it isn’t in the official process. Mark can’t find the order number, so the request goes back to Lisa, who goes back to the customer. Those loops add crossings, and the longest waits are often there, so draw the unhappy path before you decide the chart is done.
Now look at who owns what. Lisa owns her boxes and Mark owns his. Nobody owns the arrow between them, so nobody notices when something has been sitting on it since Tuesday.
How to measure the wait
A rough number is enough. Pull ten recent refunds and read the timestamps from the help desk and from Stripe. For each crossing, note how long the work sat, then write the typical case and the worst case on the diagram itself.
In FlowDraw, swimlanes are in the free Flowchart library, and a connector’s label (“Add a label” in “Line properties”) is a natural place for this. Writing “Usually next day, worst was a week” on the arrow changes how people read the chart, because the wait is now part of the picture.
Ask the people as well. “What are you usually waiting for?” tells you things timestamps can’t, such as the approval that gets chased over chat, or the refund that was finished days before anyone told the customer.
Say you find that Lisa’s review takes a few minutes and Mark’s refund takes a few minutes, but Mark clears the inbox on Tuesdays and Thursdays. That is the usual shape of this problem: very little working time and a lot of elapsed time. Telling Lisa and Mark to work faster would change almost nothing.
What to do with what you find
Work through these in order, because removing a crossing beats speeding it up.
- Remove the crossing. Let support issue refunds up to a set limit, so the common case stays in one lane and billing sees only the large ones. This takes access, training and an audit trail, and for most requests it removes the longest wait.
- Make the handoff complete. Define what has to travel with the work: order number, amount, reason, who approved it. A short form stops the loop back to support.
- Shrink the batch. Clearing the inbox daily instead of twice a week may cost Mark little. If there is a reason for the batch, such as a finance close, write it on the diagram so nobody has to rediscover it.
- Give the wait an owner. Decide who notices when a request has sat too long, and make the queue visible to them.
- Tell the customer. When a wait has to stay, a message saying what is happening and when to expect the money means fewer chasers for Lisa to answer.
Not every crossing is waste. A second person checking large refunds is a control, and you would keep it on purpose. In that case, keep the crossing and shorten the time it takes.
Change the worst crossing first and measure again before moving on, because fixing one queue often moves the wait to the next. The same swimlane will show you where it went, provided someone keeps it current now that the process has changed.